
Description
- Transformez vos graphiques en une symphonie visuelle de clarté des tendances.
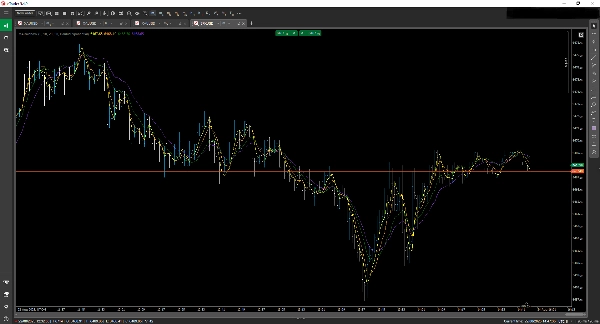
L'indicateur MARainbow est un outil élégant à moyennes mobiles multicouches conçu pour les traders qui exigent précision, flexibilité et clarté esthétique. Que vous scalpeliez les mouvements intrajournaliers ou analysiez les tendances à long terme, MARainbow vous donne un avantage avec quatre moyennes mobiles personnalisables — chacune codée par couleur pour une reconnaissance instantanée.
🔧 Caractéristiques principales
• Quatre moyennes mobiles distinctes
Affichez jusqu'à 4 moyennes mobiles simultanément, chacune avec sa propre couleur et réglage de période pour une différenciation visuelle rapide.
• Plusieurs types de MM
Choisissez parmi :
• Moyenne mobile simple (SMA)
• Moyenne mobile exponentielle (EMA)
• Moyenne mobile exponentielle double (DEMA)
• Et d'autres.
Mixez et assortissez selon votre stratégie.
• Entrées personnalisables
• Sélectionnez des périodes individuelles pour chaque MM
• Attribuez des couleurs uniques pour une meilleure lisibilité du graphique
• Activez ou désactivez la visibilité de chaque ligne indépendamment
• Clarté de la tendance en un coup d'œil
L'effet arc-en-ciel vous aide à identifier instantanément la direction, la force et les retournements potentiels de la tendance — plus besoin d'hésiter.
• Optimisé pour cTrader
S'intègre parfaitement à la plateforme cTrader, offrant des performances fluides et des réglages intuitifs.
Résumé
Avis clients
5 | 0 % | |
4 | 100 % | |
3 | 0 % | |
2 | 0 % | |
1 | 0 % |


