
Description
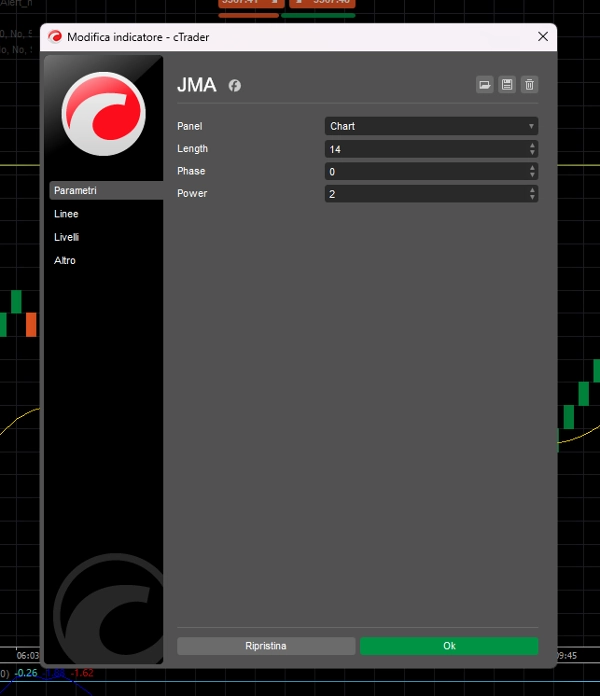
JMA-Like – Moyenne mobile adaptative sans décalage
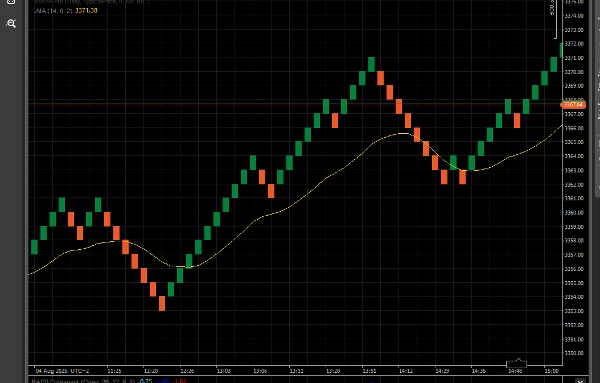
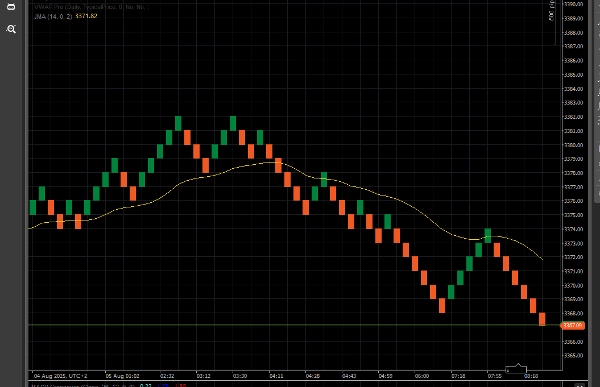
JMA Advanced est une moyenne mobile très réactive et ultra-lisse conçue pour reproduire le comportement de la moyenne mobile Jurik originale (JMA). Elle s'adapte dynamiquement à la volatilité du marché, réduisant le décalage tout en filtrant le bruit.
Construite avec des algorithmes de lissage avancés, JMA Advanced est parfaite pour les stratégies de suivi de tendance comme pour les stratégies contrariennes. Elle inclut des paramètres ajustables Phase et Power pour contrôler la réactivité et le dépassement, ce qui la rend idéale pour les traders Renko, de range et d'action sur les prix.
✅ Sensation sans décalage
✅ Adaptative à la volatilité
✅ Fonctionne sur toutes les unités de temps et types de graphiques
✅ Entièrement personnalisable
Résumé
Avis clients
5 | 100 % | |
4 | 0 % | |
3 | 0 % | |
2 | 0 % | |
1 | 0 % |


![Logo de "High-Low Divergence [Iridio Capital]"](https://cdn.ctrader.com/image/webp/443c4661-7abb-40f1-842f-4b6ec560649b_40914)


