
Description
Remarque : testé uniquement sur cTrader Windows.
Profil de volume
Un profil vertical tracé dans le graphique des prix pour montrer à quel prix il y a plus/moins de volume (intérêt de trading).
L'indicateur Flexible Volume Profile
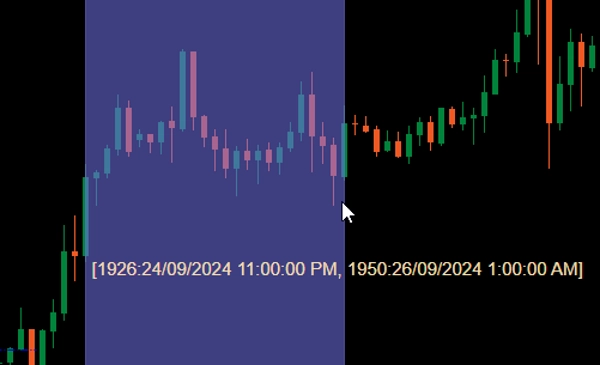
Lorsqu'il est ajouté à votre graphique, faites glisser la souris gauche tout en maintenant Ctrl sur une zone du graphique des prix pour dessiner le profil pour cette zone.
Pour des raisons de performance, le profil sera dessiné en 2 états :
- Profil grossier : L'indicateur utilisera la période définie par CoarseTF (par défaut m5) pour charger les informations de volume, ce qui est généralement rapide. Pendant que le profil grossier est affiché, le profil fin sera chargé en arrière-plan.
- Profil fin : Profil plus précis, qui utilise la période définie par FineTF (par défaut m1), mais vous pouvez la régler sur la plus fine (t1 - tick unique). Cependant, si vous visualisez un graphique en période quotidienne ou plus longue, régler sur la période des ticks augmentera le temps de chargement.
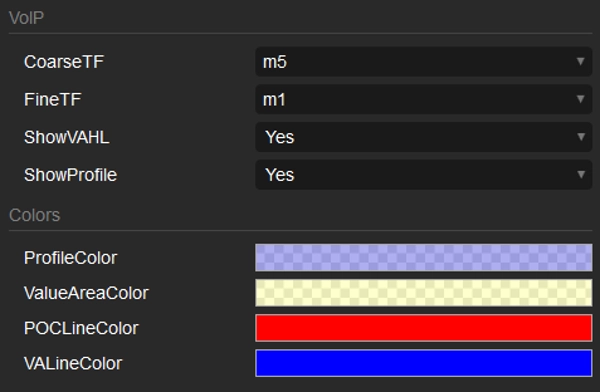
Paramètres
- CoarseTF : Période pour les données grossières (par défaut m5).
- FineTF : Période pour les données fines (par défaut m1).
- ShowVAHL : Affiche le VAH (Value Area High) et le VAL (Value Area Low).
- ShowProfile : Si Oui, affiche le profil complet, sinon affiche uniquement VAH, VAL et POC (Point de Contrôle).
- Colors : Personnalisation des couleurs.
Comment utiliser
Après avoir ajouté l'indicateur à votre graphique des prix, utilisez un glissement de la souris gauche tout en maintenant Ctrl pour sélectionner la région du graphique que vous souhaitez profiler, et c'est tout.
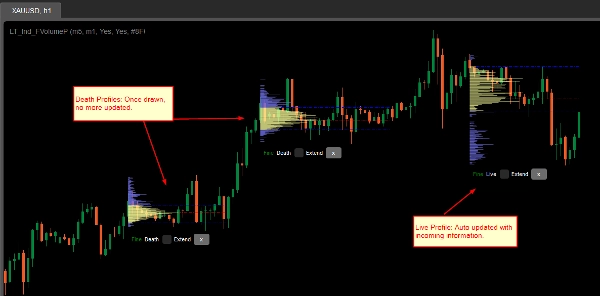
Une fois le profil rendu, vous verrez quelques informations/manipulations en bas du profil :
- Grossier/Fin : état du profil.
- Mort/Vivant : si votre profil couvre la dernière barre (bougie), alors c'est un profil vivant et automatiquement mis à jour avec les informations entrantes.
- Case à cocher Étendre : cochez pour que les lignes VAH, VAL et POC s'étendent jusqu'à la dernière barre (bougie)
- Bouton x : Cliquez pour supprimer le profil du graphique.
Résumé
Users activate the profile by holding Ctrl and dragging the mouse over a desired chart region. The indicator operates in two modes for performance optimization: a Coarse profile using a configurable timeframe (default 5 minutes) for faster loading, and a Fine profile using a finer timeframe (default 1 minute, with an option down to single ticks) for more precise volume data.
Key parameters include:
- CoarseTF and FineTF: timeframes for coarse and fine volume data aggregation.
- ShowVAHL: toggles display of Value Area High (VAH) and Value Area Low (VAL).
- ShowProfile: controls whether the full profile or only key levels (VAH, VAL, Point of Control) are shown.
- Colors: customizable color settings.
After rendering, the profile provides status indicators (Coarse/Fine, Live/Dead), options to extend VAH, VAL, and POC lines to the latest bar, and the ability to remove the profile. This tool supports detailed volume analysis to assist traders in identifying significant price levels based on traded volume.
Avis clients
5 | 100 % | |
4 | 0 % | |
3 | 0 % | |
2 | 0 % | |
1 | 0 % |


