
说明
SmartFibonacci — 自动、可配置的斐波那契回撤和扩展,支持更高时间框架,价格标签和接近警报,帮助更快、更自信地做出交易决策。
适合商店的简短描述(1-2行)
SmartFibonacci 自动检测摆动高点/低点,并在图表上绘制清晰的斐波那契回撤和可选扩展。可配置的回溯期、更高时间框架的摆动检测、带标签的价格/百分比和接近警报,使其非常适合日内剥头皮和摆动交易设置。
完整产品描述(可复制粘贴至 cTrader 商店)
SmartFibonacci 是一个轻量级、性能导向的 cTrader 指标,自动化斐波那契分析,让您花更少时间绘制水平线,更多时间进行交易。它在可配置的回溯期内定位最近的摆动高点和低点,绘制回撤水平和可选的投射(扩展)水平,并显示价格和百分比标签以便快速解读。为了获得更强的信号,SmartFibonacci 可以在更高时间框架上计算摆动点,同时在当前图表上绘制水平线。内置警报(弹出+声音)在价格进入任何可见斐波那契水平的可配置点差距离时通知您。
本列表包括:展示关键用户界面元素的清晰截图、示例工作流程、配置设置和示例输出(价格标签、扩展、警报),方便买家在购买前评估功能和用户体验。
主要功能
- 自动摆动检测 — 在可配置的回溯窗口内找到最近的摆动高点/低点。
- 更高时间框架摆动选项 — 在更高时间框架上计算摆动枢轴,获得更平滑、更有意义的水平线。
- 回撤与扩展 — 绘制标准回撤线和可选的投射(扩展)水平(用户可定义的百分比,如127.2、161.8等)。
- 价格与百分比标签 — 每个可见水平显示其百分比和精确价格,便于快速决策。
- 可定制的视觉效果 — 设置颜色(回撤/扩展)、线条粗细和线条样式。
- 接近警报 — 当价格进入可配置点差半径内的可见斐波那契水平时弹出+声音提醒;可选择仅提醒最近的水平。
- 高效重绘逻辑 — 仅在摆动枢轴变化时重绘指标,减少图表杂乱和CPU使用。
- 安全默认值 — 为希望安装后立即使用的交易者提供合理默认设置。
- 兼容 cTrader / cAlgo — 设计为覆盖指标运行。
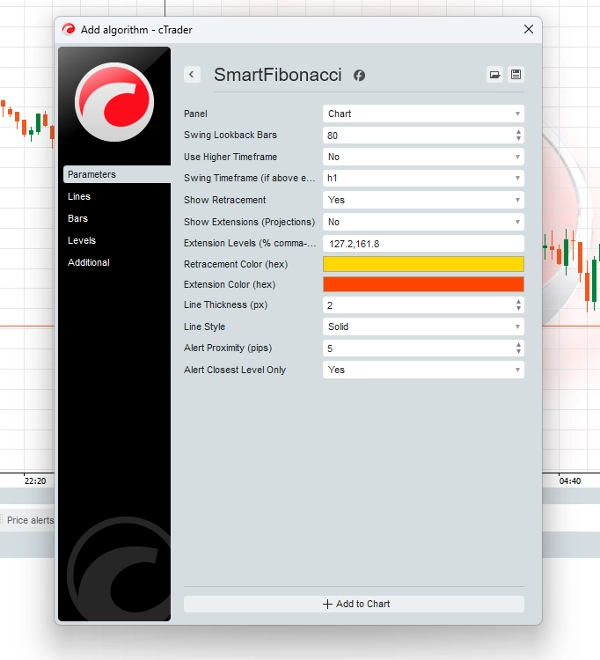
配置(参数及说明)
- 摆动回溯条数(整数) — 向后搜索多少条K线以找到摆动高点/低点(默认80)。
- 使用更高时间框架(布尔) — 启用在更高时间框架上检测,同时在当前图表绘制。
- 摆动时间框架(TimeFrame) — 启用
Use Higher Timeframe时使用的更高时间框架。 - 显示回撤(布尔) — 切换回撤水平的绘制。
- 显示扩展(布尔) — 切换扩展/投射水平的绘制。
- 扩展水平(字符串) — 用逗号分隔的百分比值(例如,
127.2,161.8)用于填充投射线。 - 回撤颜色 / 扩展颜色(十六进制) — 选择回撤线和扩展线的颜色。
- 线条粗细(像素) — 整数线条粗细设置。
- 线条样式(枚举) — 选择实线、虚线等。
- 警报接近度(点数) — 接近警报的点数距离。
- 仅警报最近水平(布尔) — 启用时,仅最近的斐波那契水平触发弹出。
分析输出及用户体验元素
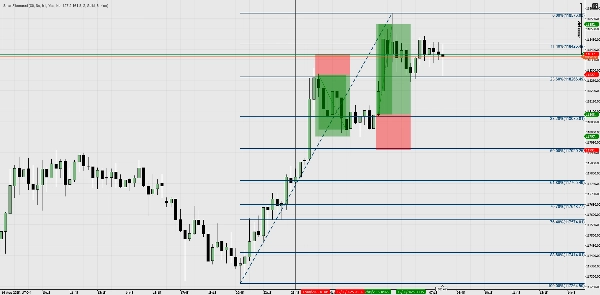
- 图表线条 — 带有清晰百分比标签(例如61.8%)和价格标签(例如1.23456)的回撤和扩展线。
- 弹出通知 — 当价格进入
Alert Proximity区域时,用户会收到屏幕弹出和系统声音。 - 非侵入性重绘 — 仅在检测到的摆动变化时更新,避免频繁重绘闪烁。
- 价格来源一致性 — 警报和标签使用绘制斐波那契的相同Bars序列计算(使用更高时间框架计算时尤为重要)。
示例工作流程 / 使用场景
- 快速设置(剥头皮/日内交易)
-
- 将 SmartFibonacci 附加到5分钟图表,设置
Lookback = 80,ShowRetrace = true。 - 观察回撤水平,使用61.8% / 50%作为日内反应区。
- 启用
Alert Proximity = 5 pips,当价格接近重要水平时收到通知。
- 将 SmartFibonacci 附加到5分钟图表,设置
- 更高时间框架背景(摆动交易)
-
- 设置
Use Higher Timeframe = true并选择Higher Timeframe = H4(或日线)。 - 水平反映H4摆动,而您在H1或M30上交易 — 更好地与更高时间框架结构对齐。
- 使用扩展(127.2,161.8)作为摆动交易的利润目标。
- 设置
- 验证 + 汇合
-
- 将 SmartFibonacci 水平与您现有的支撑/阻力、结构突破或移动平均线结合,验证入场点。
- 使用弹出警报来把握入场时机或记录交互以便回测。
- 基于警报的工作流程
-
- 在监控多个图表时保持指标开启;当价格接近任何配置的可见斐波那契水平时接收弹出通知并相应操作。
摘要
AI 摘要
SmartFibonacci is a cTrader indicator that automates Fibonacci retracement and extension analysis by detecting recent swing high and low points within a configurable lookback period. It supports higher timeframe swing detection to provide smoother, more meaningful levels while displaying retracement and optional extension lines with clear price and percentage labels directly on the chart. Users can customize visual elements such as colors, line thickness, and styles. The indicator includes proximity alerts with popup and sound notifications when price approaches configured Fibonacci levels, with options to alert only the nearest level. Efficient redraw logic updates levels only when swing pivots change, minimizing chart clutter and CPU usage. SmartFibonacci is suitable for intraday scalping and swing trading, offering workflows for quick setup on lower timeframes or higher timeframe context for swing trades. It integrates with existing analysis by allowing combination with support/resistance and other tools, and supports alert-driven monitoring across multiple charts. Configuration parameters include swing lookback bars, higher timeframe usage, retracement and extension toggles, extension level percentages, alert proximity distance, and visual settings. The indicator runs as an overlay on cTrader/cAlgo charts.
指标配置
客户评价
5.0
评价:2
5 | 100 % | |
4 | 0 % | |
3 | 0 % | |
2 | 0 % | |
1 | 0 % |
客户评价
November 9, 2025
SmartFibonacci is a clean, dynamic auto-Fibo tool that adapts to trend shifts in real time. Accurate, fast, and visually clear - perfect for mapping retracements and targets. Add alerts, and it’s an ideal companion for both swing and intraday traders.
August 19, 2025
讨论
常见问答
cTrader Store 提供的所有产品,包括交易机器人、指标和插件,均由第三方开发者提供,仅供信息参考和技术访问之用。cTrader Store 并非经纪商,不提供投资建议、个人推荐或任何未来业绩保证。


价格
注册日期 22/11/2024
135
销售
2.6K
免费安装