
Mô tả
⚡ Tính Năng Chính
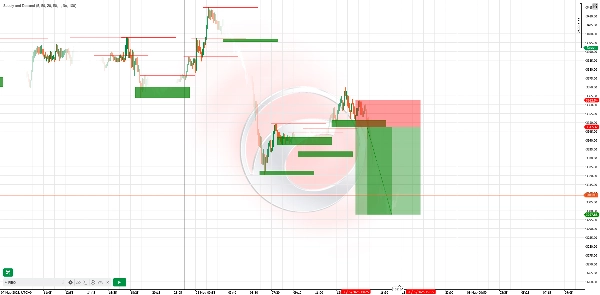
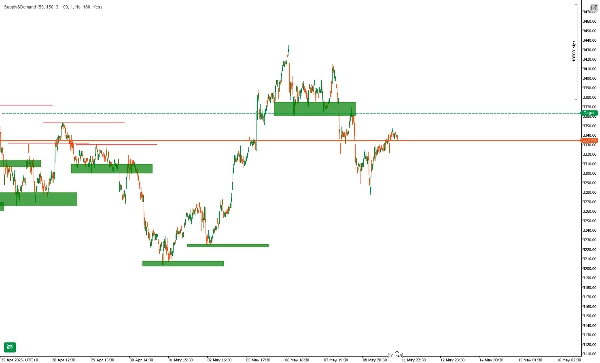
- Phát Hiện Vùng Động
-
- Tự động phát hiện đỉnh/đáy swing và vẽ các vùng cung (kháng cự) & cầu (hỗ trợ) theo thời gian thực.
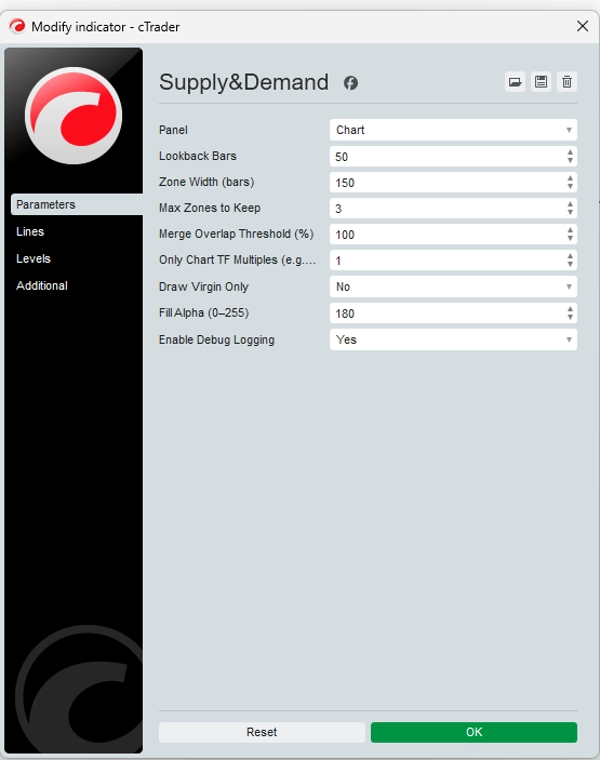
- Các tham số lookback & độ rộng vùng có thể cấu hình cho phép bạn điều chỉnh độ nhạy phù hợp với bất kỳ thị trường hoặc khung thời gian nào.
- Làm Nổi Bật Vùng Chưa Chạm
-
- Các vùng “chưa chạm” mới (chưa từng bị giá chạm) được nhấn mạnh trực quan—giao dịch tại nơi các tổ chức đã đặt lệnh.
- Tùy chọn ẩn các vùng đã chạm để giữ biểu đồ của bạn gọn gàng.
- Lọc Nhiều Khung Thời Gian
-
- Chỉ vẽ các vùng phù hợp với bội số khung thời gian của biểu đồ bạn (ví dụ: hiển thị vùng hàng ngày trên biểu đồ 1 giờ của bạn).
- Nhanh chóng thấy sự hội tụ của cung/cầu khung thời gian cao hơn với thiết lập trong ngày của bạn.
- Không Vẽ Lại & Không Trễ
-
- Các vùng được cố định khi vẽ—không có đường biến mất hoặc dịch chuyển sau khi giá di chuyển.
- Đã kiểm tra lại: các vùng giữ nguyên, giúp bạn tự tin trong phân tích lịch sử.
- Cảnh Báo & Ghi Nhật Ký Tùy Chỉnh
-
- Nhận cảnh báo bật lên hoặc email khi giá vào hoặc phá vỡ một vùng.
- Nhật ký gỡ lỗi chi tiết hiển thị việc tạo vùng, các vùng chồng bị bỏ qua và các lần chạm vùng.
🚀 Cách Hoạt Động
- Phát Hiện Pivot: Chỉ báo quét mỗi cây nến mới để tìm đỉnh pivot (cung) và đáy pivot (cầu) dựa trên lookback bạn chọn.
- Xây Dựng Vùng: Với mỗi pivot, một vùng hình chữ nhật được vẽ kéo dài về phía trước—làm nổi bật nơi các tổ chức có thể đã đặt lệnh giới hạn.
- Lọc Chồng Lấn: Các vùng chồng lấn vượt quá ngưỡng của bạn sẽ hợp nhất hoặc bỏ qua, đảm bảo chỉ những khu vực quan trọng nhất được giữ lại.
- Tùy Chọn Chỉ Vùng Chưa Chạm: Chỉ giữ các vùng chưa bị chạm hiển thị để tập trung vào các mức độ tổ chức mới nhất.
🎯 Ví Dụ Chiến Lược Giao Dịch
Chiến LượcKhung Thời GianVào LệnhDừng LỗChốt Lời
Từ Chối Vùng
H1
Chờ giá tăng vào vùng cầu và xuất hiện nến giảm (nhấn chìm/đinh ghim) trong vùng cung
Ngay ngoài ranh giới vùng
1.5× chiều cao vùng
Hội Tụ Khung Thời Gian
M15 + H4
Xác định vùng cầu H4, sau đó chuyển sang M15 để tìm nến tăng động lượng trong vùng đó
Dưới đáy vùng H4
Đỉnh swing H4 tiếp theo
Phá Vỡ & Kiểm Tra Lại
H4
Sau khi giá phá vỡ vùng cung, chờ kiểm tra lại mặt dưới vùng và xác nhận giảm giá
Trên đỉnh vùng
Đáy H4 gần đây
Mẹo Sử Dụng: Kết hợp với phân kỳ RSI hoặc MACD trong các vùng để có tín hiệu xác suất cao hơn.
📈 Ví Dụ Thực Tế
- Trên EURUSD H4, chỉ báo vẽ một vùng cầu tại 1.0950–1.0980.
- Giá giảm vào vùng, in ra cây nến M15 tăng nhấn chìm.
- Vào lệnh tại 1.0970, dừng lỗ tại 1.0945 (dưới vùng), mục tiêu tại 1.1040 (kháng cự H4 tiếp theo).
- Kết quả: +70 pips (~6.4× rủi ro).
⚠️ Tuyên Bố Miễn Trừ
Chỉ báo này là một công cụ—không phải hệ thống đảm bảo lợi nhuận. Hiệu suất trong quá khứ không đảm bảo kết quả tương lai. Luôn sử dụng quản lý rủi ro phù hợp (ví dụ: tối đa 2% mỗi giao dịch), thử nghiệm trên tài khoản demo trước, và kết hợp với phân tích riêng của bạn. Giao dịch có rủi ro thua lỗ; chỉ giao dịch với vốn bạn có thể chịu mất.
Tóm tắt
It supports multi-timeframe filtering, allowing users to display zones aligned with higher timeframe multiples on lower timeframe charts, facilitating confluence analysis. Zones are non-repainting and non-lagging; once drawn, they remain fixed, ensuring reliable historical analysis. Custom alerts notify users when price enters or breaks these zones, and detailed logs track zone creation and interactions.
The indicator operates by scanning each new bar for pivot highs and lows, constructing rectangular zones extending forward, and filtering overlapping zones to retain the most significant areas. It offers a “virgin-only” mode to focus on fresh institutional levels.
Example strategies include zone rejection, multi-timeframe confluence, and break & retest setups, often combined with RSI or MACD divergence for higher-probability signals. A real-world example on EURUSD H4 demonstrates entry, stop-loss, and take-profit placement based on demand zones and candlestick confirmation.
Đánh giá của khách hàng
5 | 75 % | |
4 | 25 % | |
3 | 0 % | |
2 | 0 % | |
1 | 0 % |


