
Deskripsi
Indikator BLOCK LIQUIDITY menggabungkan dua pendekatan utama untuk analisis pasar:
Deteksi Order Block:
Mengidentifikasi area support dan resistance berdasarkan titik tertinggi dan terendah yang tidak terputus dalam periode lookback.
Menghasilkan sinyal beli ketika harga ditutup di atas titik terendah yang tidak terputus.
Menghasilkan sinyal jual ketika harga ditutup di bawah titik tertinggi yang tidak terputus.
Analisis Likuiditas:
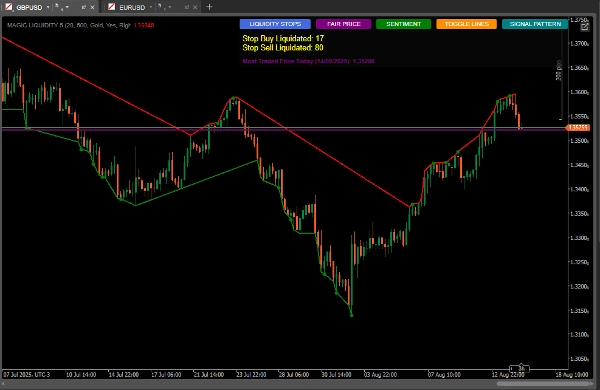
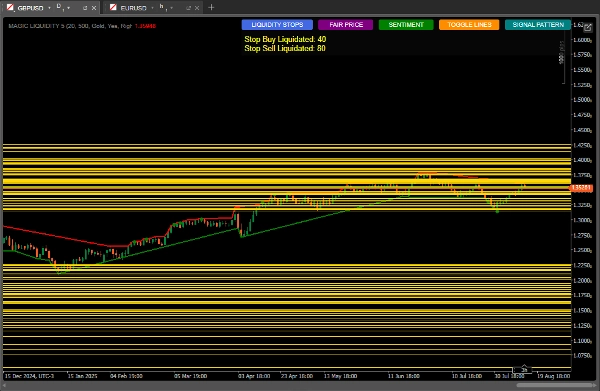
Mendeteksi kumpulan likuiditas (area di mana stop loss mungkin terkonsentrasi).
Memantau aktivasi stop beli dan jual.
Menghitung sentimen pasar berdasarkan distribusi likuiditas.
Mengidentifikasi harga yang paling banyak diperdagangkan (harga wajar).
Cara Menggunakan untuk Hasil Terbaik
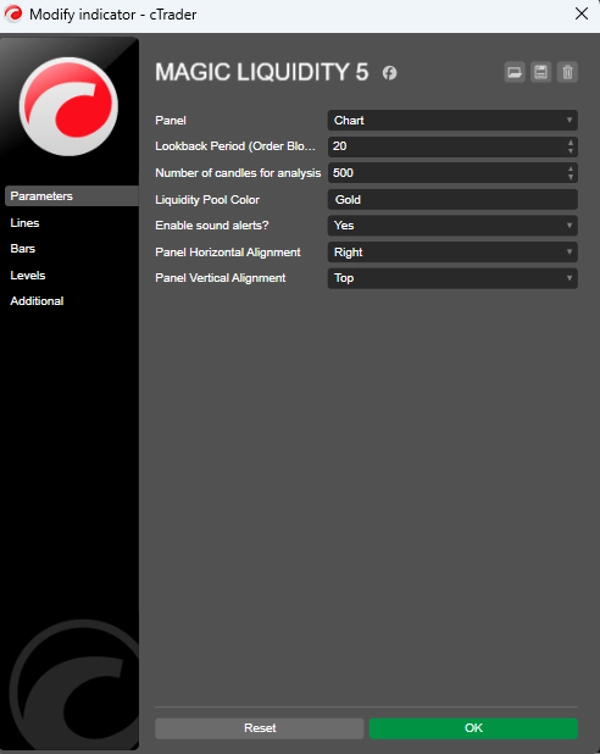
Konfigurasi Awal
Periode Lookback: Sesuaikan parameter "Lookback Period" sesuai dengan kerangka waktu yang Anda perdagangkan (nilai lebih tinggi untuk kerangka waktu yang lebih tinggi).
Jumlah Candle untuk Analisis: Pertahankan pada 500 untuk analisis yang kuat atau kurangi untuk reaksi yang lebih cepat.
Warna Kumpulan Likuiditas: Pilih warna yang menonjol pada grafik Anda.
Interpretasi Sinyal
Sinyal Order Block:
Titik hijau: Sinyal beli ketika harga ditutup di atas titik terendah yang belum pernah dilampaui.
Titik merah: Sinyal jual ketika harga ditutup di bawah titik tertinggi yang belum pernah dilampaui.
Kumpulan Likuiditas:
Garis horizontal menunjukkan area likuiditas (target potensial atau titik pembalikan).
Pantau hubungan antara likuiditas di atas/bawah harga saat ini.
Sentimen Pasar:
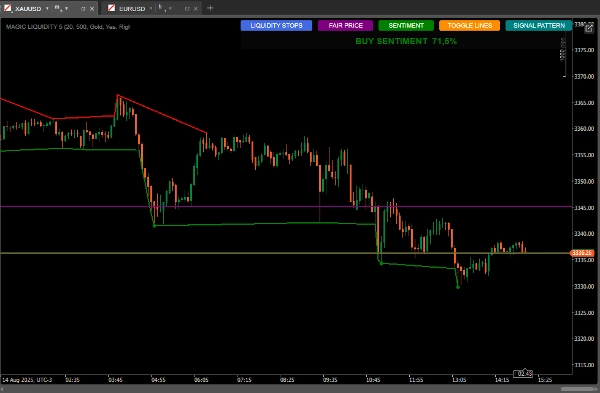
Gunakan tombol "SENTIMENT" untuk melihat arah dan kepercayaan yang berlaku.
Sentimen beli dengan kepercayaan tinggi menunjukkan pertumbuhan yang berlanjut. Sentimen jual dengan kepercayaan tinggi menunjukkan kelanjutan tren bearish.
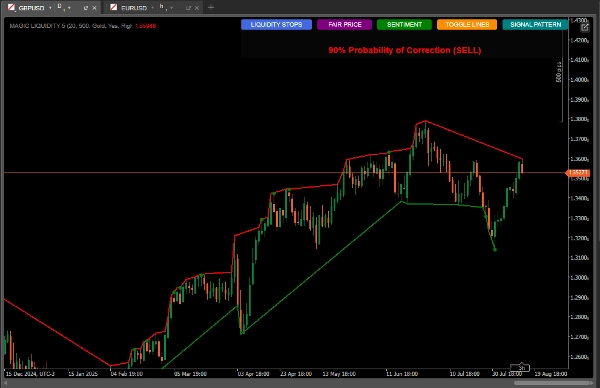
Pola Candlestick:
Tombol "SIGNAL PATTERN" menganalisis dan
Menampilkan probabilitas koreksi berdasarkan rasio kuantitatif
Harga yang Paling Banyak Diperdagangkan (Harga Wajar):
Tombol "FAIR PRICE" menunjukkan level harga dengan volume tertinggi hari itu.
Ini dapat berfungsi sebagai magnet untuk harga atau sebagai support/resistance.
Strategi Penggunaan
Strategi Konservatif:
Perdagangkan hanya ketika sinyal order block bertepatan dengan sentimen yang berlaku.
Gunakan kumpulan likuiditas sebagai target take-profit.
Strategi Agresif:
Antisipasi pembalikan ketika harga mendekati kumpulan likuiditas dengan banyak stop yang terkumpul.
Gunakan divergensi antara sentimen dan aksi harga untuk perdagangan melawan tren.
Konfirmasi Tambahan:
Bandingkan dengan pola candlestick yang ditampilkan oleh indikator.
Periksa apakah harga wajar berada di dekat sebagai area yang menarik.
Manajemen Risiko.
Stop-Loss:
Tempatkan di bawah order block terbaru untuk pembelian
Tempatkan di atas order block terbaru untuk penjualan
Take-Profit:
Target di kumpulan likuiditas terdekat
Pertimbangkan rasio likuiditas atas/bawah untuk menetapkan target
Tips Lanjutan
Gunakan tombol "TOGGLE LINES" untuk menonaktifkan garis likuiditas ketika grafik menjadi penuh
Pantau jumlah stop yang dilikuidasi untuk menilai kekuatan pergerakan
Harga wajar sangat berguna di pasar yang terbatas seperti support/resistance dinamis
Gabungkan dengan indikator lain untuk konfirmasi (volume, moving averages)
Volume indikator:
https://ctrader.com/pt/products/635
Ringkasan
Users can customize parameters such as lookback period and number of candles analyzed to suit different timeframes and trading styles. Visual signals include green and red dots for buy and sell order block signals, and horizontal lines marking liquidity pools. Additional features include sentiment indication with confidence levels, candlestick pattern analysis for correction probabilities, and toggling of liquidity lines for chart clarity.
Recommended strategies include trading in the direction of order block signals aligned with sentiment for conservative approaches, or anticipating reversals near liquidity pools for aggressive trades. Risk management is supported by placing stop-loss orders relative to recent order blocks and setting take-profit targets at liquidity pools. The indicator can be combined with other tools like volume and moving averages for confirmation.
Ulasan pelanggan
5 | 100 % | |
4 | 0 % | |
3 | 0 % | |
2 | 0 % | |
1 | 0 % |


