
PVA Volume+Analysis_noSourceCode
インジケーター
449 ダウンロード数
バージョン 1.0、Mar 2025
Windows、Mac
5.0
レビュー: 3
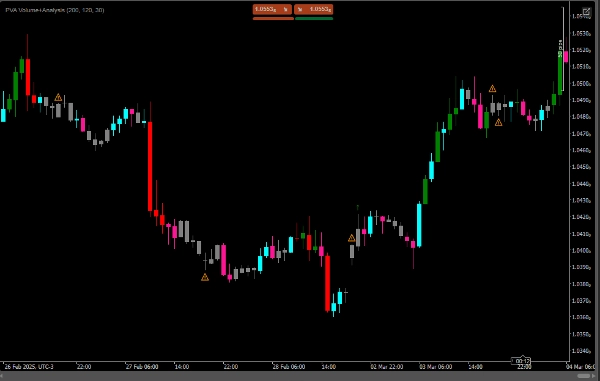
PVA(価格・出来高分析)は、金融資産の価格と取引量の関係を研究するテクニカル分析の手法です。PVAの基本的な考え方は、取引量がトレンドの強さと方向性に関する重要な情報を提供し、トレーダーがより情報に基づいた意思決定を行うのに役立つということです。
- 価格上昇とともに出来高が増加:強い上昇トレンドを示し、緑色のシンボル(上向き矢印)が表示されます。
- 価格下落とともに出来高が増加:強い下降トレンドを示し、赤色のシンボル(下向き矢印)が表示されます。
- 価格上昇とともに出来高が減少:上昇トレンドの勢いが弱まっている可能性を示し、オレンジ色の警告(警告シンボル)が表示されます。
- 価格下落とともに出来高が減少:下降トレンドの勢いが弱まっている可能性を示し、オレンジ色の警告(警告シンボル)も表示されます。
- 上昇または下降の動きで出来高が減少している場合、警告マーク(⚠️)が描かれます。
インジケーターのプロフィール
5.0
レビュー: 3
5 | 100 % | |
4 | 0 % | |
3 | 0 % | |
2 | 0 % | |
1 | 0 % |
カスタマーレビュー
January 28, 2026
August 12, 2025
Pros: Detailed price-volume analysis, highlights high-activity zones, useful for VSA trading. Cons: No alerts, no MTF mode, can be resource-heavy with large history. Requires experience to interpret.
May 13, 2025
cTrader Storeで入手可能な取引ボット、インジケーター、プラグインなどの商品は、第三者の開発者が提供するものであり、情報と技術の取得のみを目的としてご利用いただけます。cTrader Storeはブローカーではなく、投資助言や個人的な推奨を行うことも、将来のパフォーマンスを保証することもありません。


これも好きかも


111
販売
8.39K
無料インストール