Description
Complétez vos stratégies avec cet indicateur de signal👇🏻
https://ctrader.com/pt/products/1560?u=Goulart
✔Caractéristiques de l'indicateur
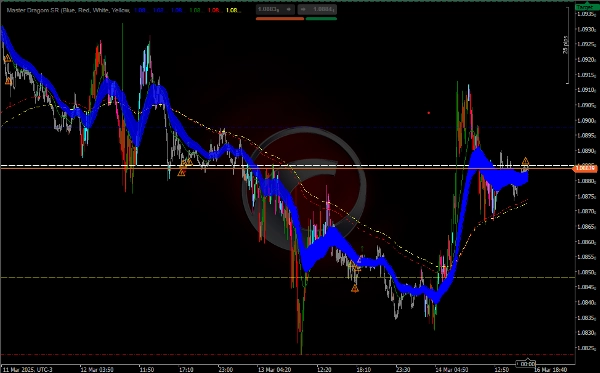
Support et Résistance (SR) :
L'indicateur trace des lignes horizontales pour les niveaux de support et de résistance quotidiens, hebdomadaires et mensuels.
Vous pouvez activer ou désactiver chaque niveau (ouverture, clôture, haut et bas) selon vos besoins.
Moyennes Mobiles Exponentielles (EMA) :
L'indicateur calcule plusieurs EMA (50, 25, 200 et 233 périodes) pour aider à identifier les tendances et les zones potentielles de support/résistance dynamique.
Les EMA sont tracées sur le graphique en différentes couleurs pour une visualisation facile.
Analyse du Volume (PVAVolumeAnalysis) :
L'indicateur analyse le volume pour identifier d'éventuels retournements ou continuations de tendance.
Il met en évidence les barres avec un volume supérieur à la moyenne et signale les changements significatifs de volume avec des icônes (↑, ↓, ⚠️).
Coloration des Barres :
Les barres sont colorées en fonction du volume et de la direction du prix (hausse ou baisse), ce qui aide à identifier la force de la tendance.
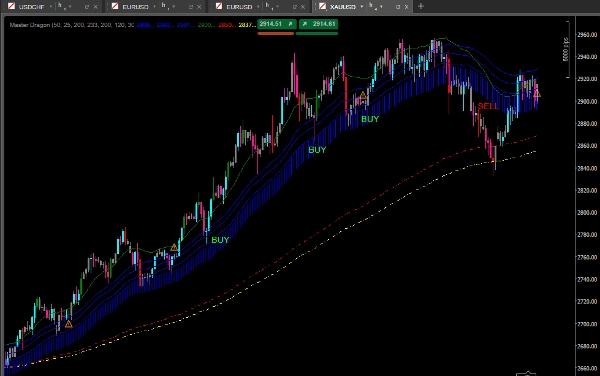
Analyse de la Tendance avec les EMA :
Utilisez les EMA pour identifier la direction de la tendance :
Si le prix est au-dessus des EMA (en particulier les EMA 200 et 233), la tendance est haussière.
Si le prix est en dessous des EMA, la tendance est baissière.
La zone entre le plus haut et le plus bas de l'EMA 50 peut être utilisée comme zone d'intérêt pour des retournements ou continuations potentiels.
Analyse du Volume :
Observez les icônes et les couleurs des barres pour identifier les changements de volume :
Volume élevé avec prix en hausse (↑) : Confirmation d'une tendance haussière.
Volume élevé avec prix en baisse (↓) : Confirmation d'une tendance baissière.
Volume faible avec prix en hausse ou en baisse (⚠️) : Possible retournement.
Combinaison des Signaux :
Combinez les signaux de volume, d'EMA et des niveaux SR pour prendre des décisions d'entrée ou de sortie.
Par exemple, si le prix est proche d'un niveau de résistance et que le volume diminue, cela pourrait être un signal de retournement.
Stratégie Suggérée
Stratégie de Tendance avec Confirmation de Volume
Identifier la Tendance :
Utilisez les EMA (200 et 233) pour déterminer la tendance principale.
Si le prix est au-dessus des EMA, considérez uniquement les achats.
Si le prix est en dessous des EMA, considérez uniquement les ventes.
Attendre un Repli :
Attendez que le prix revienne vers une EMA de période plus courte (50 ou 25) ou vers un niveau SR.
Confirmer avec le Volume :
Vérifiez si le volume augmente dans la direction de la tendance (↑ pour les achats, ↓ pour les ventes).
Les MA localisent les tendances, les replis, signalent les volumes, les retournements, le support et la résistance.
Si le volume diminue (⚠️), évitez d'entrer ou considérez un retournement.
Entrée :
Achetez lorsque le prix est au-dessus des EMA et proche d'un niveau de support, avec un volume confirmant la tendance haussière.
Vendez lorsque le prix est en dessous des EMA et proche d'un niveau de résistance, avec un volume confirmant la tendance baissière.
Sortie :
Utilisez les niveaux SR ou les EMA comme objectifs ou points de sortie.
Par exemple, clôturez ou vendez lorsqu'il atteint un niveau de support.
Résumé
Volume analysis is integrated to detect potential trend reversals or continuations by highlighting bars with above-average volume and signaling significant volume changes using icons (↑ for rising volume confirming uptrends, ↓ for falling volume confirming downtrends, and ⚠️ for low volume indicating possible reversals). Bars are color-coded based on volume and price direction to visually represent trend strength.
Traders can combine signals from volume, EMAs, and support/resistance levels to make informed entry and exit decisions. A suggested strategy involves identifying the main trend using the 200 and 233 EMAs, waiting for pullbacks to shorter EMAs or support/resistance levels, and confirming with volume signals before entering trades. Exit points can be set at support/resistance levels or EMA lines. This indicator is suitable for enhancing trend, pullback, volume, reversal, and support/resistance analysis in various trading strategies.
Avis clients
5 | 100 % | |
4 | 0 % | |
3 | 0 % | |
2 | 0 % | |
1 | 0 % |