
Fixed Range Volume Profile
Indicateur
2 achats
Version 1.0, Jan 2026
Windows, Mac
4.0
Avis : 2
Description
Comment utiliser le Fixed Range Volume Profile (FRVP)
- Activez l'indicateur : Faites glisser et déposez le FRVP Indicator sur le graphique souhaité depuis le menu cTrader Automate ou Indicateurs.
- Sélectionnez l'outil d'analyse : Trouvez l'outil standard Rectangle Drawing Tool dans la barre d'outils cTrader (généralement à droite ou à gauche de la plateforme).
- Définissez votre plage : Cliquez et faites glisser le rectangle sur l'action de prix et la période temporelle spécifiques que vous souhaitez analyser.
- Initialisez le profil : Après avoir dessiné, cliquez et poussez légèrement le rectangle. Cette "poignée de main" entre le dessin et l'indicateur déclenche le calcul du volume, générant instantanément l'histogramme, le POC et les lignes de la zone de valeur.
- Ajustez dynamiquement : Vous pouvez faire glisser les bords du rectangle pour étendre la plage temporelle ou le déplacer sur une autre jambe de prix ; le profil de volume se recalculera automatiquement pour refléter la nouvelle zone.
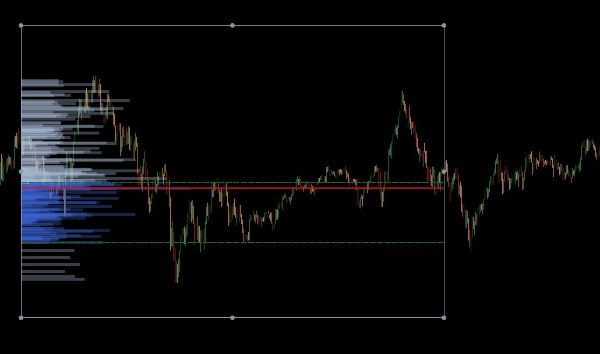
Le Fixed Range Volume Profile (FRVP) pour cTrader est un outil d'analyse sophistiqué conçu pour identifier des niveaux de prix significatifs en calculant la distribution du volume sur une plage spécifique de temps et de prix. Contrairement aux indicateurs de volume standard qui correspondent au temps, cet indicateur se concentre sur la densité des prix pour révéler le sentiment du marché.
Fonctionnalités principales
- Sélection dynamique de la plage : L'indicateur calcule et met à jour automatiquement chaque fois que vous dessinez ou déplacez un rectangle standard sur votre graphique cTrader.
- Identification des niveaux clés :
-
- Point de Contrôle (POC) : Met en évidence le niveau de prix avec le volume échangé le plus élevé, agissant comme un "aimant" pour l'action des prix.
- Valeur Haute/Basse (VAH/VAL) : Définit les limites où un pourcentage spécifique du volume (par défaut 40%) a été échangé.
- Mises en page personnalisables :
-
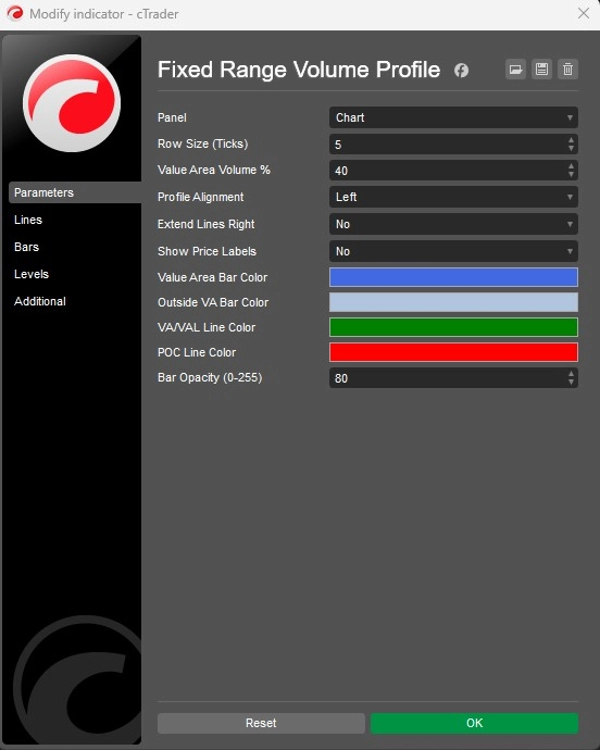
- Alignement : Choisissez d'afficher l'histogramme de volume du côté Gauche ou Droite de la boîte.
- Granularité : Ajustez la Taille des lignes (par défaut 5 ticks) pour contrôler le détail des barres de volume.
- Visuels : Contrôle total sur les couleurs des barres (Zone de valeur vs. Extérieur), l'opacité et la visibilité des étiquettes de prix.
Application stratégique
- Support & Résistance : Les Nœuds de Volume Élevé (HVN) agissent souvent comme un support ou une résistance forte, tandis que les Nœuds de Volume Faible (LVN) représentent des zones "minces" où le prix peut évoluer rapidement.
- Confirmation de tendance : Utilisez la fonction Extend Right pour voir comment les niveaux de volume historiques interagissent avec l'action des prix actuelle au fur et à mesure de son développement.
Résumé
Résumé IA
The Fixed Range Volume Profile (FRVP) indicator for cTrader analyzes volume distribution within a user-defined price and time range using a standard rectangle drawing tool. By selecting and adjusting this rectangle on the chart, the indicator dynamically calculates and displays a volume histogram along with key levels: Point of Control (POC), which marks the price with the highest traded volume, and Value Area High/Low (VAH/VAL), defining the volume concentration boundaries. Users can customize the histogram’s alignment, granularity (row size), colors, opacity, and price label visibility. The indicator supports dynamic range adjustments by dragging the rectangle edges, automatically recalculating volume data. Strategically, it helps identify support and resistance zones through high and low volume nodes and offers trend confirmation by extending volume levels into current price action. The FRVP is applicable across various markets including Forex, cryptocurrencies, commodities, indices, and stocks, and supports symbols such as BTCUSD, EURUSD, GBPUSD, XAUUSD, and NAS100. It integrates with cTrader’s drawing tools and provides a detailed volume-based perspective on price action beyond standard time-based volume indicators.
Profil de l'indicateur
Avis clients
4.0
Avis : 2
5 | 0 % | |
4 | 100 % | |
3 | 0 % | |
2 | 0 % | |
1 | 0 % |
Discussion
Questions fréquentes
BTCUSD
Forex
Signal
Breakout
Indices
EURUSD
Commodities
GBPUSD
NZDUSD
Fibonacci
Prop
Scalping
Fair Value Gap
SMC
Crypto
Stocks
XAUUSD
NAS100
USDJPY
VWAP
Les produits disponibles sur cTrader Store, notamment les bots de trading, les indicateurs et les plug-ins, sont fournis par des développeurs tiers et mis à disposition à titre informatif et à des fins d'accès technique uniquement. cTrader Store n'est pas un courtier et ne fournit aucun conseil en investissement, aucune recommandation personnelle ni aucune garantie quant aux performances futures.
Plus de cet auteur


![Logo de "Smart Money Concepts (SMC) [Iridio Capital]"](https://cdn.ctrader.com/image/webp/28b69fd1-ef54-4bed-9487-07e78e883be4_40934)


Prix
Depuis le 26/09/2025
13
Ventes