
Description
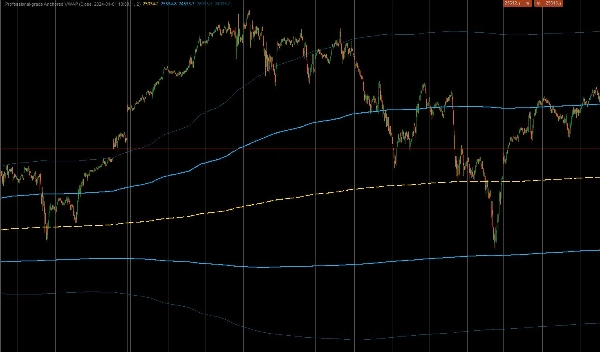
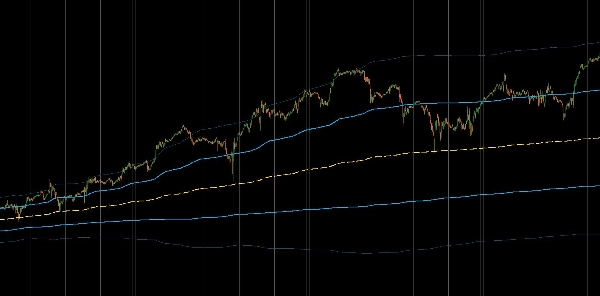
Il s'agit d'un indicateur personnalisé de qualité professionnelle pour cTrader conçu pour calculer le Prix Moyen Pondéré par le Volume Ancré (AVWAP). Contrairement aux indicateurs VWAP standard qui se réinitialisent quotidiennement, cet outil permet aux traders de "ancrer" le calcul à un événement spécifique à fort impact — tel qu'une publication de l'IPC, un krach boursier ou le début d'une tendance — offrant une véritable vue institutionnelle du prix moyen depuis ce moment. Il inclut également des bandes d'écart-type pondérées par le volume pour identifier les mouvements de prix excessifs.
1. Calcul de base & logique d'ancrage
- Ancrage précis : L'indicateur utilise une
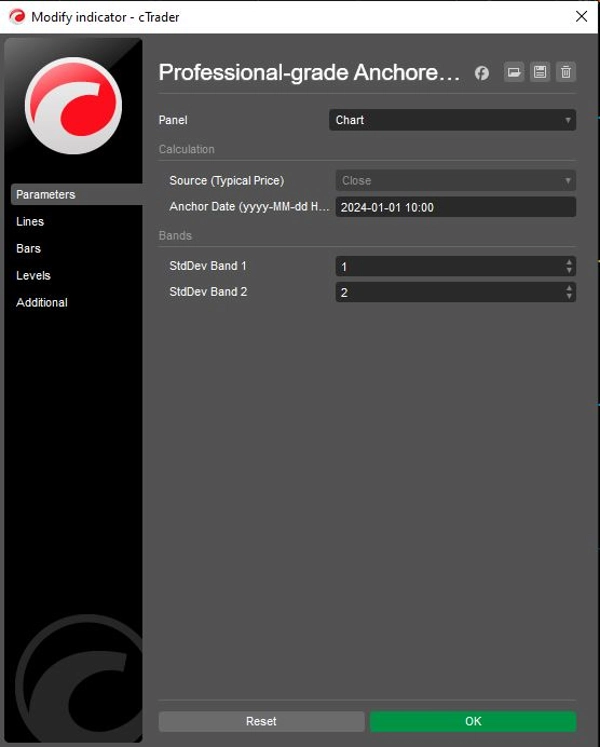
Date d'ancragedéfinie par l'utilisateur (par exemple, "2024-01-01 10:00") pour ignorer strictement toutes les données antérieures à cette minute précise. Cela garantit que le prix moyen reflète uniquement les participants impliqués dans le mouvement ou la période spécifique en cours. - Formule institutionnelle : Il calcule le véritable VWAP en utilisant la somme cumulée de (Prix × Volume) divisée par la somme cumulée du Volume.
- Source de prix typique : Par défaut, il utilise le
Prix Typique(Haut + Bas + Clôture) / 3pour les calculs, méthode standard utilisée par les algorithmes institutionnels pour déterminer la juste valeur, bien que cela puisse être ajusté aux prix d'ouverture ou de clôture.
2. Bandes de volatilité avancées
Pour aider les traders à évaluer les extrêmes du marché, l'indicateur calcule deux ensembles de bandes dynamiques basées sur la Variance pondérée par le volume :
- Bande 1 (La zone de valeur) : Par défaut à 1,0 écart-type. Cette zone intérieure contient généralement le "bruit" de la juste valeur du marché. Une sortie de cette zone signale souvent un momentum.
- Bande 2 (La zone extrême) : Par défaut à 2,0 écarts-types. Les prix atteignant cette bande extérieure sont statistiquement surétendus, signalant souvent des opportunités potentielles de retour à la moyenne (atténuation du mouvement) ou une forte fatigue de la tendance.
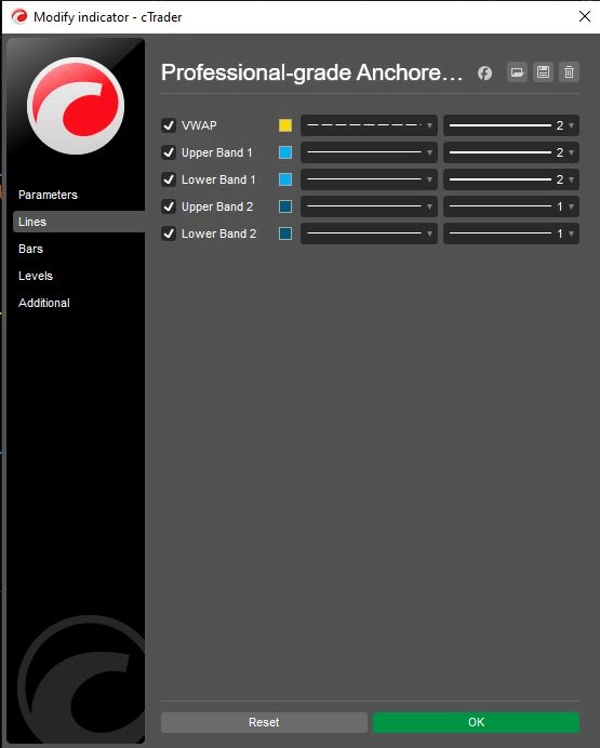
- Contrôle indépendant : Les deux bandes incluent des bascules individuelles
Show(ShowBand1,ShowBand2) et des multiplicateurs d'écart personnalisables (Band1Dev,Band2Dev), permettant des graphiques épurés adaptés à des stratégies de volatilité spécifiques.
3. Logique visuelle & opérationnelle
- Codage couleur stratégique :
-
- Jaune (VWAP) : Sert de "magnétisme" central ou de ligne de base de la tendance.
- Vert citron (Bande 1) : Représente la "zone de valeur" de support/résistance immédiate.
- Rouge (Bande 2) : Met en évidence les déviations extrêmes où la probabilité de retournement augmente.
- Préservation de l'état : Le code utilise
IndicatorDataSeriespour les variables d'état internes (_cumVol,_cumPV), garantissant que les valeurs restent précises lors des recalculs historiques et des mises à jour en temps réel sans erreurs de repeinture.
Résumé du flux logique
- Initialiser : Analyser la chaîne spécifique de la Date d'ancrage de l'utilisateur en un objet DateTime système.
- Filtrer le temps : Pour chaque barre, vérifier si l'heure actuelle est avant l'ancre. Si oui, retourner
NaN(ne rien dessiner) et réinitialiser les compteurs cumulés à zéro. - Accumuler les données : Une fois l'heure d'ancrage atteinte, commencer à ajouter le volume de la barre actuelle et (Prix × Volume) au total en cours.
- Calculer le VWAP : Diviser le total PV en cours par le total du volume en cours pour obtenir la ligne VWAP.
- Calculer la variance : Calculer la variance pondérée par le volume et en déduire l'écart-type.
- Tracer les bandes : Ajouter/Soustraire la déviation calculée du VWAP pour tracer les bandes verte citron et rouge.
Résumé
Key features include:
- Precision anchoring to a user-specified date and time, ignoring data before that moment.
- Institutional VWAP calculation using cumulative (Price × Volume) divided by cumulative Volume.
- Default use of Typical Price ((High + Low + Close) / 3) for fair value, adjustable to Open or Close prices.
- Two dynamic volatility bands based on volume-weighted variance: Band 1 (1 standard deviation) representing the value zone, and Band 2 (2 standard deviations) indicating extreme price deviations.
- Independent toggles and customizable deviation multipliers for each band.
- Strategic color coding: yellow for VWAP, lime green for Band 1, and red for Band 2.
- Internal state preservation ensures accurate values during historical and real-time updates without repainting.
The indicator supports markets including Forex, indices, commodities, stocks, and cryptocurrencies, and is suitable for various symbols such as BTCUSD, EURUSD, GBPUSD, XAUUSD, and NAS100.
Avis clients
5 | 50 % | |
4 | 50 % | |
3 | 0 % | |
2 | 0 % | |
1 | 0 % |


