
Session HighLow Pivot Points Indicator advanced version
مؤشر
560 التنزيلات
الإصدار 1.0، Nov 2025
Windows, Mac
5.0
التقييمات: 1
الوصف
مؤشر جلسات التداول
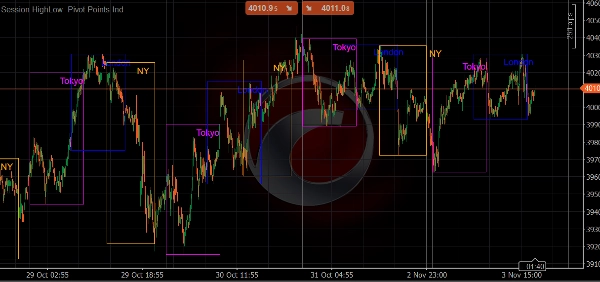
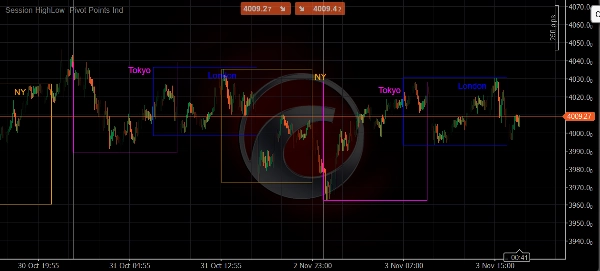
عزز تحليلك للسوق باستخدام هذا المؤشر الاحترافي للجلسات الذي يعرض بصريًا الجلسات الأربع الرئيسية للتداول:
🕒 الميزات الرئيسية:
- أربع جلسات رئيسية: نيويورك، لندن، طوكيو، وسيدني
- أوقات قابلة للتخصيص: ضبط أوقات البدء/الانتهاء لكل جلسة
- صناديق ملونة: لكل جلسة ألوان مميزة لتسهيل التعرف عليها
- بيانات تاريخية: تستمر صناديق الجلسات عبر جميع بيانات المخطط التاريخية
- مرئيات نظيفة: بدون فوضى - فقط تصور واضح لنطاق الجلسة
🎯 مثالي لـ:
- تحديد تداخلات الجلسات وفترات التقلب العالي
- فهم هيكل السوق عبر المناطق الزمنية
- تخطيط الصفقات حول افتتاح وإغلاق الجلسات
- تحليل متعدد الأطر الزمنية مع سياق الجلسة
⚙️ إعدادات قابلة للتخصيص:
- تمكين/تعطيل الجلسات الفردية
- ضبط أوقات الجلسة لتتناسب مع وسيطك
- تغيير الألوان لتتناسب مع موضوع المخطط الخاص بك
- تبديل تسميات الجلسات وشفافية الصناديق
أوقات الجلسات الافتراضية:
- طوكيو: 00:00 - 09:00 UTC
- لندن: 07:00 - 16:00 UTC
- نيويورك: 13:00 - 22:00 UTC
- سيدني: 21:00 - 06:00 UTC
مثالي لمتداولي الفوركس، محللي السوق، وأي شخص يحتاج إلى تصور واضح للجلسات على مخططاته.
الملخص
ملخص الذكاء الاصطناعي
The Session HighLow Pivot Points Indicator advanced version visually displays the four major global trading sessions—New York, London, Tokyo, and Sydney—on trading charts. It uses color-coded range boxes to clearly mark each session's timeframe, which persist across historical data for comprehensive analysis. Users can customize session start and end times to align with their broker’s schedule, enable or disable individual sessions, adjust colors to match chart themes, and toggle labels and box transparency. Default session times are set in UTC: Tokyo (00:00–09:00), London (07:00–16:00), New York (13:00–22:00), and Sydney (21:00–06:00). This indicator aids in identifying session overlaps, high volatility periods, and understanding market structure across time zones. It supports multi-timeframe analysis and is suitable for forex, indices, commodities, crypto, and stocks markets, including symbols like BTCUSD, EURUSD, GBPUSD, XAUUSD, NAS100, and USDJPY. The tool is designed for traders and analysts who require clear visualization of trading sessions to plan trades around session openings and closings.
ملف تعريف المؤشر
تقييمات العملاء
5.0
التقييمات: 1
5 | 100 % | |
4 | 0 % | |
3 | 0 % | |
2 | 0 % | |
1 | 0 % |
تقييمات العملاء
December 18, 2025
Before this indicator, my session-based strategy was all manual guesswork. Now, I get a clean, automated structural read of the Asian, London, and NY ranges at a glance. It doesn’t trade for you, but it perfectly frames the battlefield—making confluences with order flow or price action far more actionable. A professional-grade tool that's become essential to my pre-market analysis.
مناقشة
الأسئلة الشائعة
BTCUSD
Forex
Signal
Indices
EURUSD
Commodities
GBPUSD
NZDUSD
Prop
Crypto
Stocks
XAUUSD
NAS100
USDJPY
يتم توفير المنتجات المتاحة من خلال cTrader Store، بما في ذلك روبوتات التداول والمؤشرات والإضافات، من قبل مطوري الطرف الثالث وإتاحتها لأغراض الوصول المعلوماتي والفني فقط. cTrader Store ليس وسيطًا ولا يقدم نصائح استثمارية أو توصيات شخصية أو أي ضمان للأداء المستقبلي.


السعر
10M
حجم التداول
10.64K
الربح بالبيب
23
المبيعات
1.24K
التثبيتات المجانية