
الوصف
Market Cipher A هو مؤشر تقني متقدم مصمم لتحليل سهل، وتحديد، وتوقع الاتجاهات الكبرى في سوق العملات المشفرة.
الهيكل والمكونات
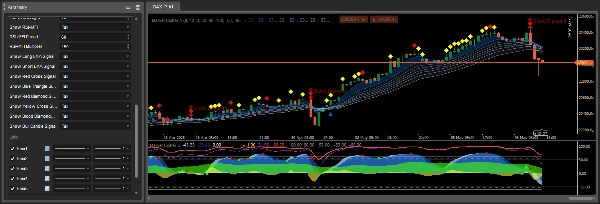
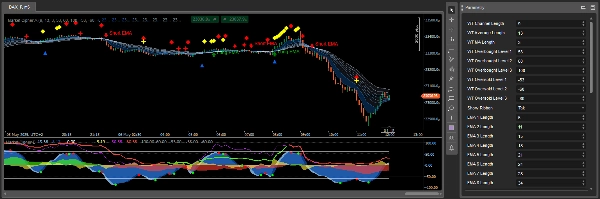
يتكون Market Cipher A من شريط مكون من 8 متوسطات متحركة أسيّة (EMA) تتغير ألوانها حسب اتجاه السوق. يتحول شريط EMA إلى اللون الأزرق أو الأبيض خلال سوق صاعدة وإلى الرمادي خلال سوق هابطة.
بشكل افتراضي، تُستخدم المتوسطات المتحركة ذات قيم EMA من 5 إلى 34. يمكن أن تكون تقاطعات هذه الخطوط مؤشرات تأخيرية قوية جدًا، ولهذا السبب تم برمجة Market Cipher A لعرض الرموز تلقائيًا التي تتوافق مع إشارات مختلفة، مما يلغي الحاجة إلى التفسير اليدوي لكل تقاطع صعودي أو هبوطي.
الرموز وإشارات التداول
يعرض Market Cipher A رموزًا مميزة مباشرة على مخطط الشموع تشير إلى فرص تداول محتملة:
المثلث الأزرق - إشارة انعكاس الاتجاه، تشير إلى تراجع الزخم واقتراب الانعكاس. إنها تحذير مبكر بأن زخم الاتجاه يتناقص.
الدائرة الخضراء - مؤشر صعودي، الأكثر موثوقية على أطر زمنية 6 ساعات وما فوق. عادةً ما تظهر بعد المثلث الأزرق ويجب تفسيرها ضمن نطاق 1-3 شموع.
الألماس الأصفر - تشير إلى استمرار الاتجاه الصاعد. يجب استخدامها مع شريط EMA لتأكيد أفضل لاتجاه الاتجاه.
الألماس الأحمر - تشير إلى ضعف الاتجاه واحتمال استمرار هبوط السعر. تدل على زيادة الزخم الهبوطي.
الصليب الأحمر - مؤشر هبوطي، الأكثر فعالية على أطر زمنية ساعة واحدة وما فوق. يجب استخدامه مع شريط EMA والألماس الأحمر.
الصليب الأصفر - يشير إلى تلاعب في السوق، خصوصًا تغطية مراكز شراء كبيرة يتم شراؤها وبيعها بسرعة بواسطة مراكز بيع قصيرة.
الألماس الأحمر الكبير (الألماس الدموي) - الإشارة الأكثر هبوطًا، تدل على احتمال كبير للانخفاض، خاصة عند حدوثها مع الصليب الأحمر أو الألماس الأحمر الأصغر.
مبادئ الاستخدام
يوفر Market Cipher A دعمًا أو مقاومة رياضية قوية بصريًا، مما يسهل فهم بيئة التداول. يعمل بشكل أفضل مع شموع Heiken Ashi.
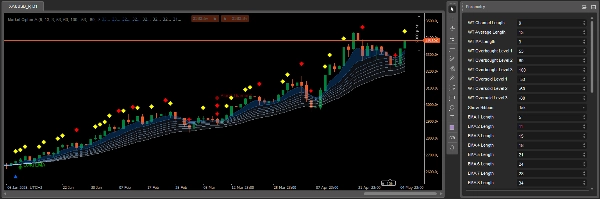
لا يشير شريط EMA فقط إلى الاتجاه بل يعمل أيضًا كمستويات دعم ومقاومة ديناميكية. عندما يكون الشريط أزرق/أبيض والشموع فوقه، يمكنك البحث عن فرص لاتخاذ مراكز شراء. وعندما يكون الشريط رمادي والشموع تحته، يمكنك التفكير في مراكز بيع.
تحقق أفضل النتائج عند دمج إشارات Market Cipher A مع مؤشرات أخرى من حزمة Market Cipher، خصوصًا Market Cipher B الذي يوفر إشارات زخم إضافية ونقاط دخول.
تفسير الإشارة التفصيلي في سياق الاتجاه
جانب مهم في Market Cipher A هو تفسير الإشارات حسب السياق اعتمادًا على الاتجاه السائد. عندما يتغير لون الشريط من الرمادي إلى الأزرق، يولد المؤشر دائرة خضراء كإشارة لبداية اتجاه صاعد. عادةً، بعد الدائرة الخضراء، إذا ظهرت شموع 1-3 التالية ألماسًا أصفر، فإن احتمال حدوث اختراق مرتفع. ومع ذلك، إذا ظهرت الألماسات الحمراء، فإن الاختراق أقل احتمالًا.
خلال سوق صاعدة، تكون الألماسات الصفراء مفضلة، حيث تظهر استمرارًا صاعدًا متوافقًا مع الاتجاه، بينما تمثل الألماسات الحمراء حركة معاكسة للاتجاه. في سوق هابطة، الوضع معكوس - الألماسات الحمراء مفضلة كاستمرار للانخفاض، والألماسات الصفراء تشير إلى حركة صعودية مؤقتة مخالفة للاتجاه.
الصليب الأحمر هو الأكثر موثوقية عندما يظهر بعد الألماس الأحمر ويكون شريط EMA مضغوطًا تقريبًا بالكامل، ويتغير لونه إلى الرمادي الهبوطي. تختلف دقة هذا المؤشر حسب الإطار الزمني.
آلية العمل وتكوين الإشارة
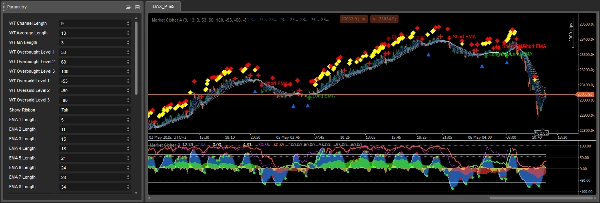
تُولد الرموز والإشارات في Market Cipher A بناءً على عدة مصادر: تقاطعات موجة WaveTrend، مستويات التشبع الشرائي والبيعي، وبناءً على RSI وMFI عند عبور الخط المركزي أو الوصول إلى حالات التشبع الشرائي والبيعي. يجعل هذا التحليل متعدد الأبعاد الإشارات أكثر شمولاً من المؤشرات الفردية.
يتكون شريط EMA من 8 متوسطات متحركة تشكل شريطًا مميزًا مع فصل بين الأشرطة الفردية. فصل الأشرطة عامل مهم - يشير الفصل الواسع إلى اتجاه قوي، بينما يشير تضييق الأشرطة إلى ضعف الزخم أو التوحيد.
التطبيق العملي في استراتيجيات التداول
تم تصميم Market Cipher A بشكل أساسي كأداة لتحليل الاتجاه، لذا يعمل بشكل أفضل في استراتيجيات تتبع الاتجاه. يُنصح باستخدام الشريط مع مؤشرات تحديد الاتجاه الأخرى، ثم البحث عن فرص التداول أثناء ارتدادات السعر.
من المهم أن تتذكر أن هذه الإشارات تساعد في ضبط توقيت الدخول أو الخروج من الصفقات، ولكن لا ينبغي استخدامها بمفردها لاتخاذ قرارات التداول. هناك حاجة إلى تأكيدات إضافية، خاصة لإشارات الانعكاس التي تحدث خلال تحركات سعرية جانبية.
الملخص
The indicator automatically displays distinct symbols on the price chart to signal potential trading opportunities:
- Blue Triangle: signals declining momentum and possible trend reversal.
- Green Circle: indicates a bullish trend start, most reliable on 6-hour timeframes and above.
- Yellow Diamonds: suggest continuation of an upward trend.
- Red Diamonds: indicate trend weakening and potential downward continuation.
- Red X: bearish signal effective on 1-hour timeframes and higher.
- Yellow X: points to market manipulation events.
- Large Red Diamond ("Blood Diamond"): strong bearish signal with high probability of decline.
Signals are generated using a combination of WaveTrend crossovers, RSI, and MFI indicators, providing multidimensional market analysis. Market Cipher A is optimized for use with Heiken Ashi candles and is best applied within trend-following strategies, ideally combined with other Market Cipher indicators for enhanced entry and momentum confirmation.
تقييمات العملاء
5 | 67 % | |
4 | 33 % | |
3 | 0 % | |
2 | 0 % | |
1 | 0 % |


