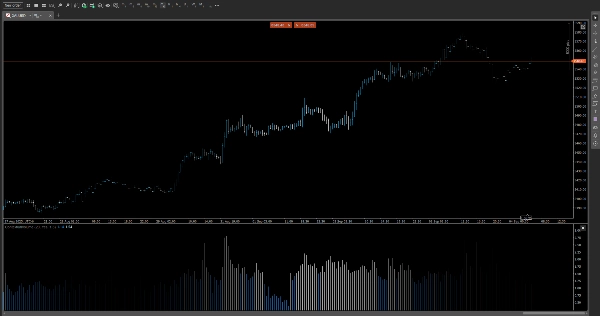
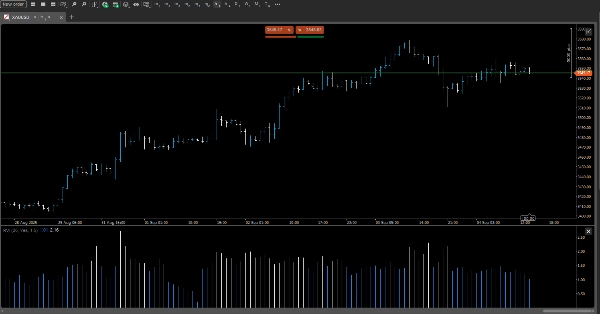
مؤشر
Indices
Prop
Breakout
Commodities
Forex
Crypto
RVI
شعار "RVI"
04/09/2025
Desktop
صورة "RVI" المحملةصورة "RVI" المحملة

📊 Relative Volume Intraday (RVI)

Spot the volume surges that matter—when they matter.

RVI is a precision-crafted indicator that compares current volume to its historical average for the same time of day, revealing hidden momentum and liquidity shifts across intraday sessions.


🔍 Key Features

Time-of-Day Volume Profiling

Calculates average volume per time slot (e.g., 10:15 AM) across previous sessions, giving you a contextual benchmark for every candle.

Multi-Timeframe Support

Works seamlessly from 5-minute charts up to 12-hour timeframes, adapting to your trading style—scalping, swing, or session-based.

Dynamic Color Coding

Highlights candles with above-average volume using customizable color thresholds. Instantly spot high activity zones with intuitive visual cues.

Ratio vs. Difference Mode

Choose your preferred metric:

Ratio Mode: Displays current volume ÷ average volume (e.g., 2.3×)

Difference Mode: Shows absolute deviation (e.g., +1,200 contracts)

Overlay or Panel Display

Toggle between inline chart overlays or a compact side panel for clean integration with your existing layout.


🎯 Use Cases

Confirm breakout strength with volume spikes relative to typical activity

Filter false signals during low-volume periods

Identify institutional footprints during key intraday windows

Enhance volume-based strategies with time-aware context


⚙️ Customization Options

Adjustable lookback period for historical averaging

User-defined color thresholds for volume intensity

Toggle display mode (Ratio/Difference)

Compatible with dark/light themes

0.0
التقييمات: 0
تقييمات العملاء
لا توجد تقييمات لهذا المنتج حتى الآن. هل جرَّبته بالفعل؟ كن أول من يخبر الآخرين!
المزيد من هذا المؤلف
FVG
The Indicator is a powerful tool for price-action traders seeking to identify and exploit short-term imbalances.
مؤشر
Indices
Prop
Stocks
+3
Fractals
Fractals is a precision-engineered trading indicator for cTrader that reveals the hidden architecture of price action.
مؤشر
Grid
NAS100
XAUUSD
+6
AutoFibRetracement
A powerful overlay tool designed to automatically plot Fibonacci retracement levels based on a custom window.
مؤشر
Indices
Prop
Stocks
+3
Smooth Heiken Ashi
The Smooth Heiken Ashi indicator is a refined charting tool designed to filter out market noise and highlight true price
مؤشر
NAS100
Indices
XAUUSD
+4
PrevDayProjection
Automatically calculates the previous day’s high and low, determines the range, and then projects Fibonacci levels.
مؤشر
NAS100
Indices
XAUUSD
+6
JacksonZones
Maps intraday and multiday structure using Fibonacci-projected session ranges.
pATR
An indicator that redefines ATR by applying a percentile-based filter giving traders a grounded view of volatility.
DEnvelopSystem
DEnvelop is a high-performance trading indicator engineered for scalpers and intraday strategists who demand precision.
مؤشر
Breakout
AI
Scalping
KaufmanEfficiencyRatio
A precision tool for measuring how efficiently price moves from point A to B.
مؤشر
Indices
Prop
Commodities
+3
OBScope
A cutting-edge indicator designed to detect and visualize high-probability zones based on swing highs, swing lows.
مؤشر
NAS100
Indices
XAUUSD
+7
T3 Moving Average
A next‑generation moving average designed to deliver exceptional smoothness with minimal lag.
مؤشر
Indices
XAUUSD
Breakout
+3
AnchoredVWAP
A precision overlay tool that combines session-aware VWAP logic and standard deviations.
مؤشر
Indices
Breakout
Prop
+8
MarketRegimeAI
A cutting‑edge trading indicator that fuses AI and mathematics with adaptive logic to classify market regimes.
مؤشر
NAS100
Indices
XAUUSD
+7
InstitutionalSignalOscillator
A precision-engineered indicator designed for traders who demand signal integrity across volatile markets.
cBot
NAS100
Indices
XAUUSD
+4
VolatilityScalper
A trading robot designed for traders who want precision for high-volatility markets (XAUUSD, US500, US100, WTI, others.)
مؤشر
Indices
Commodities
Stocks
+2
MARainbow
MARainbow gives you the edge with four customizable moving averages—each color-coded for instant recognition.
قد يعجبك أيضًا
مؤشر
NAS100
Indices
XAUUSD
+6
JacksonZones
Maps intraday and multiday structure using Fibonacci-projected session ranges.
مؤشر
Grid
NAS100
RSI
+21
Market Cipher B
Market Cipher B
مؤشر
XAUUSD
Forex
EURUSD
+3
Fx4U.Risk & Reward Trading Tool.v2.16 -Indicator
This is a tool to help traders open orders/close orders/modify orders quickly with just one click
Chart Overview
ChartOverview – The Comprehensive Market Snapshot
مؤشر
RSI
XAUUSD
Breakout
+4
S&R Structural ZigZag
"Detects swings 🎯, draws zigzag trends 📈📉, support/resistance ⏹️, labels HH/HL/LH/LL, Tracks market structure 🚀🐻."
مؤشر
NAS100
NZDUSD
Martingale
+24
LookPosOrderIndicator
On-chart draggable panel to show/hide Positions & Pending Orders with fixed warning banner and inline alerts per symbol.
Microchannels
Microchannels
mIntrinsicRecursiveValue
Intrinsic Recursive Value Indicator
مؤشر
NAS100
NZDUSD
Breakout
+17
Deviation Indicator by PrimeQuant
True Deviation - Trade extremes and reversions with deviation channels, SMC swings, liquidity levels, and impulse bias.
الأعلى تقييمًا
مجاني
مؤشر
Breakout
BreakOut_Probability_Expo
Break Out Probability Experimental indicator. Credits for this indicator goes to Zeiierman !!!
مؤشر
Indices
Prop
Stocks
+3
ADX Indicator_noSourceCode
Identify Trend Strength with Absolute Precision on cTrader
مؤشر
Indices
AI
Machine Learning Momentum Index
The Machine Learning Momentum Index (MLMI) represents the next step in oscillator trading.
الأعلى تقييمًا
مجاني
مؤشر
RSI
Breakout
XAUUSD
+5
Auto-Trend Channel
Adaptive trend channel using linear regression and Pearson correlation for dynamic support, resistance, and trends.
مؤشر
RSI
Breakout
Supertrend
Market Trend OB
Price action to detect when the market changes trend (MSB) and defines, order blocks , ZigZag etc.📊
مؤشر
Indices
Prop
Stocks
+6
New Way Sar - Pro
The Parabolic SAR, or "Stop and Reverse," is a dynamic technical analysis tool
الأعلى تقييمًا
مجاني
VGM - Auto Fibo Retracement
Auto Fibonacci Retracement Indicator.
مؤشر
NAS100
NZDUSD
XAUUSD
+13
WT - Hawkes Process
Identifies market compression zones and explosive Breakout moments using mathematical modeling.