
FVG
Indicador
1.07K transferências
Versão 1.1, Dec 2025
Windows, Mac
Descrição
🧠 Indicador Fair Value Gap (FVG)
Revele Desequilíbrios Ocultos do Mercado com Precisão
O Indicador Fair Value Gap (FVG) é uma ferramenta poderosa para traders de price-action que buscam identificar e explorar ineficiências de curto prazo causadas pelo fluxo agressivo de ordens institucionais. Baseado em uma lógica robusta de 3 barras, ele detecta automaticamente zonas FVG de alta e baixa — áreas onde o preço pode retornar antes de continuar sua tendência.
🔍 Principais Características
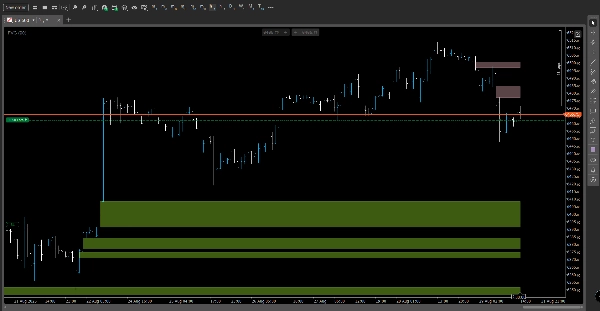
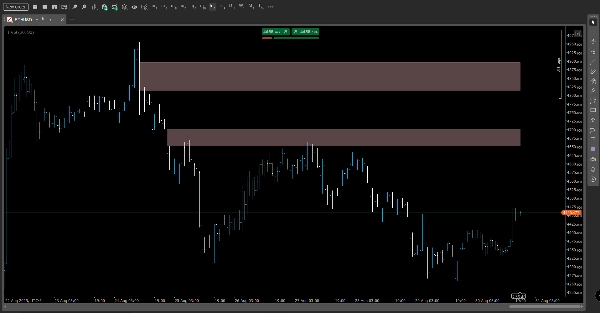
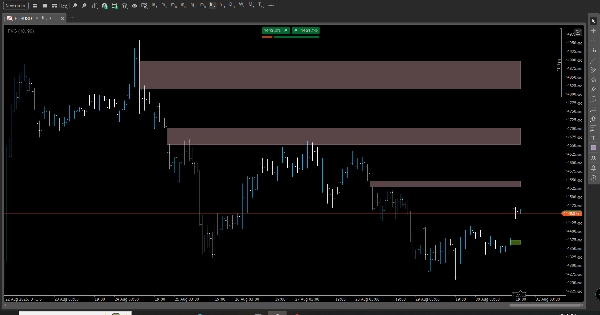
- Detecção Automática de FVG: Destaca zonas de desequilíbrio usando retângulos limpos e não repintáveis baseados em gaps de velas.
- Rastreamento de Mitigação: Monitora quando o preço revisita e preenche um gap, atualizando visuais e registrando eventos de mitigação.
- Sobreposição de Zona Não Mitigada: Exibe FVGs ativos como linhas horizontais em negrito para referência rápida e planejamento de trades.
- Limiar Adaptativo: Escolha modos de limiar manual ou automático para ajustar a sensibilidade em mercados voláteis ou calmos.
- Visuais Personalizados: Configure cores, opacidade e comprimento da projeção para combinar com seu estilo de gráfico.
- Registro no Terminal: Logs compactos reportam gaps totais, mitigações e zonas ativas — perfeito para validação de estratégias.
🎯 Benefícios
- Referências Claras para Trades: Use zonas FVG como alvos de retorno, áreas de reação ou confluência com outros conceitos de smart money.
- Baixa Pegada Visual: Design limpo mantém seus gráficos legíveis enquanto preserva o contexto essencial de desequilíbrio.
- Backtesting Confiável: Lógica de barra fechada garante sinais estáveis sem repintura.
- Pronto para Multi-Tempos: Ideal para scalpers, swing traders e analistas no estilo institucional.
👤 Para Quem É
- Traders de Smart Money & ICT
- Puristas do Price Action
- Analistas Quantitativos validando reações de fluxo de ordens
- Traders buscando entradas de alta probabilidade baseadas na estrutura do mercado
Resumo
Resumo de IA
The Fair Value Gap (FVG) Indicator is designed for price-action traders to identify short-term market imbalances caused by institutional order flow. It uses a 3-bar logic to automatically detect bullish and bearish FVG zones—price gaps where the market may return before continuing its trend. Key features include automated detection with non-repainting rectangles, mitigation tracking that updates when gaps are filled, and an overlay of active unmitigated zones for easy reference. Users can adjust sensitivity via manual or automatic threshold modes and customize visual elements such as colors and opacity. The indicator logs gap statistics and mitigation events in the terminal for strategy validation. It supports multi-timeframe analysis, making it suitable for scalpers, swing traders, and institutional-style analysts. The FVG Indicator provides clear trade reference points, a low visual footprint to maintain chart readability, and reliable backtesting signals based on closed-bar logic. It is intended for traders focused on smart money concepts, price action, and order-flow validation seeking high-probability entries aligned with market structure.
Perfil do indicador
Avaliações de clientes
0.0
Avaliações: 0
Avaliações de clientes
Ainda não há avaliações para este produto. Já o experimentou? Seja o primeiro a contar a outras pessoas!
Conversa
Perguntas frequentes
Os produtos disponíveis através da cTrader Store, incluindo bots de negociação, indicadores e plugins, são fornecidos por programadores terceiros e são disponibilizados apenas para fins informativos e de acesso técnico. A cTrader Store não é um corretor e não fornece aconselhamento em matéria de investimento, recomendações pessoais ou qualquer garantia de desempenho no futuro.


![Logótipo de "Gaussian Channel [Iridio Capital]"](https://cdn.ctrader.com/image/webp/7c039209-5573-4a54-a072-f9528b503103_41960)


Preço
26
Vendas
2.14K
Instalações gratuitas