Descripción
📈 Indicador AutoFibRetracement
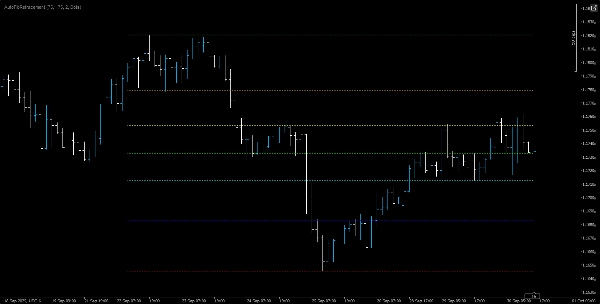
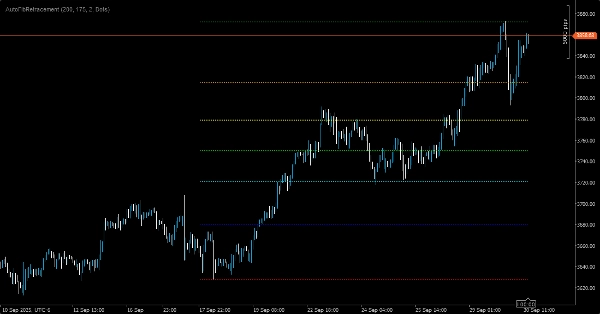
El indicador AutoFibRetracement es una herramienta superpuesta potente diseñada para trazar automáticamente niveles de retroceso de Fibonacci basados en oscilaciones recientes de precios. Ideal para traders que buscan identificar zonas potenciales de soporte y resistencia, este indicador calcula dinámicamente los niveles de retroceso usando parámetros personalizables y los muestra directamente en el gráfico.
🔧 Características clave:
• Detección automática de oscilaciones: Calcula los máximos y mínimos dentro de una ventana de retroceso definida por el usuario.
• Ventana de período personalizable: Los traders deben seleccionar una ventana adecuada para capturar con precisión los máximos y mínimos significativos. Esta elección es crucial para alinear los niveles de retroceso con la estructura real del mercado.
• Niveles de Fibonacci: Incluye ratios estándar — 0%, 23.6%, 38.2%, 50%, 61.8%, 78.6% y 100% — cada uno codificado por colores para mayor claridad visual.
• Opciones de estilo visual:
• Opacidad ajustable (0–255) para la transparencia de las líneas.
• Grosor y estilo de línea configurables (por ejemplo, punteado, sólido).
• Visualización superpuesta: Dibuja directamente en el gráfico de precios para una integración fluida con otras herramientas de análisis técnico.
🎯 Caso de uso:
Perfecto para traders de oscilación, seguidores de tendencias y analistas técnicos que dependen de las zonas de retroceso de Fibonacci para planificar entradas, salidas y niveles de stop-loss. La efectividad de este indicador depende de la capacidad del trader para elegir el tamaño correcto de la ventana — demasiado corta puede perder oscilaciones más amplias, demasiado larga puede diluir la acción reciente del precio.