
Candle Timer & Strength Demo
Indicador
266 descargas
Versión 1.0, Jul 2025
Windows, Mac
Descripción
Características clave:
- Temporizadores de velas en múltiples marcos temporales:
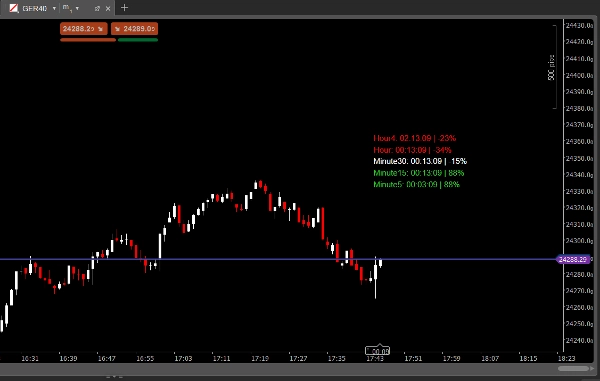
Vea la cuenta regresiva para el cierre de la próxima vela en hasta 5 marcos temporales seleccionados, todo en un panel claro. - Fuerza de la vela en %:
Vea al instante la fuerza de la vela actual (de -100% a +100%) para cada marco temporal, basado en dónde está el cierre en relación con el rango de la vela. - Panel personalizable:
-
- Establezca el tamaño de fuente, la distancia desde la última vela y el espaciado vertical.
- Elija sus marcos temporales preferidos (M1, M5, M15, M30, H1, H4, etc.).
- Los colores cambian automáticamente: verde para alcista fuerte, rojo para bajista fuerte, blanco para neutral.
- Siempre visible:
El panel siempre está visible en su gráfico, facilitando monitorear el tiempo y el impulso del mercado de un vistazo. - Perfecto para:
-
- Scalpers y daytraders que necesitan un temporizador de vela preciso.
- Traders multitemporales que quieren ver el impulso y el tiempo en un solo lugar.
- Cualquiera que quiera mejorar su sincronización de entrada/salida y habilidades de lectura de velas.
Cómo funciona:
- El indicador calcula el tiempo restante hasta el cierre de la vela actual para cada marco temporal seleccionado.
- También calcula la fuerza de la vela como un porcentaje:
-
- +100% = cierre en la parte superior de la vela (alcista fuerte)
- -100% = cierre en la parte inferior (bajista fuerte)
- 0% = cierre en el medio (neutral)
- El panel se actualiza en tiempo real y es totalmente personalizable.
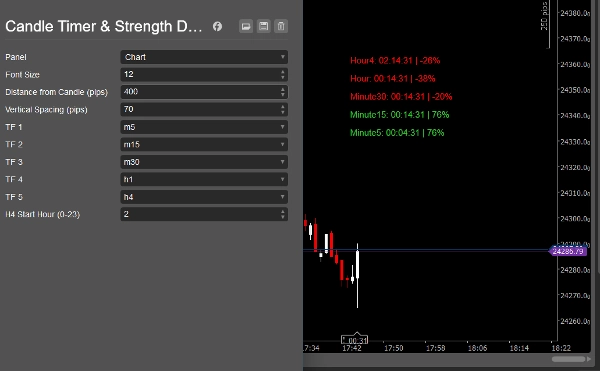
Parámetros:
- Tamaño de fuente
- Distancia desde la vela (pips)
- Espaciado vertical (pips)
- Marco temporal 1–5 (personalizado)
- Hora de inicio H4 (para brokers con velas H4 no estándar)
¿Por qué elegir Candle Timer & Strength?
- Ahorre tiempo: No más cambiar de marcos temporales o calcular cierres de velas mentalmente.
- Opere con confianza: Vea al instante si el mercado está ganando o perdiendo impulso.
- Aspecto profesional: Panel limpio y moderno que se adapta a cualquier estilo de gráfico.
- Fácil de usar: Plug & play, no se requiere codificación.
Nota:
Esta demo es solo para fines de evaluación.
Si le gusta el indicador, por favor compre la versión completa para uso ilimitado.
Para obtener la versión completa, busque "Candle Timer & Strength" en la tienda cTrader.
Vea todos mis indicadores y bots:
https://ctrader.com/pl?search=kobud.222&u=kobud.222
http://www.youtube.com/@Robi22-22
📩 ¿Preguntas? ¿Sugerencias? ¿Descuento?
Contacto disponible en mi perfil: Robikobud
Resumen
Resumen de IA
Candle Timer & Strength Demo for cTrader is an indicator designed to display real-time countdowns to the close of current candles across up to five customizable timeframes. It provides a clear panel showing the remaining time until candle close and the candle’s strength as a percentage, ranging from -100% (strong bearish) to +100% (strong bullish), based on the candle’s close position relative to its range. The panel is fully customizable, allowing users to adjust font size, vertical spacing, distance from the last candle, and select preferred timeframes such as M1, M5, M15, M30, H1, and H4. Colors dynamically indicate momentum: green for strong bullish, red for strong bearish, and white for neutral. The panel remains always visible on the chart, facilitating quick assessment of market timing and momentum. This tool is suited for scalpers, day traders, and multi-timeframe traders seeking precise candle timing and momentum insights to improve entry and exit decisions. Parameters include font size, spacing, timeframe selection, and H4 start hour adjustment for brokers with non-standard candle timings. This demo version is intended for evaluation purposes.
Perfil del indicador
Valoraciones de clientes
0.0
Valoraciones: 0
Valoraciones de clientes
Este producto todavía no se ha valorado. ¿Ya lo ha probado? Sea el primero en informar a otros.
Conversación
Preguntas frecuentes
Los productos disponibles a través de cTrader Store, incluidos bots, indicadores y plugins para operar, son proporcionados por desarrolladores de terceros y están disponibles únicamente con fines informativos y de acceso técnico. cTrader Store no es un bróker, por lo que no proporciona asesoramiento de inversión, recomendaciones personales ni ninguna garantía de rentabilidad futura.
Más de este autor


![Logotipo de "[Hamster-Coder] Pivot Points MTF"](https://cdn.ctrader.com/image/webp/4c143e5a-309c-40e3-a578-f04d1e133ffa_31159)


Precio
Desde 31/12/2024
7
Ventas
1.13K
Instalaciones gratis