Descripción
Panel de Temporizador de Velas y Fuerza DEMO para cTrader
VERSIÓN DEMO – ¡Prueba gratuita de 24 horas!
Esta es una versión DEMO del indicador Panel de Temporizador de Velas y Fuerza para cTrader.
Puedes usar todas las funciones durante 24 horas después de la instalación.
Después del período de prueba, el indicador expirará y mostrará un mensaje.
Para obtener la versión completa, busca "Panel de Temporizador de Velas y Fuerza" en la tienda de cTrader.
Características principales:
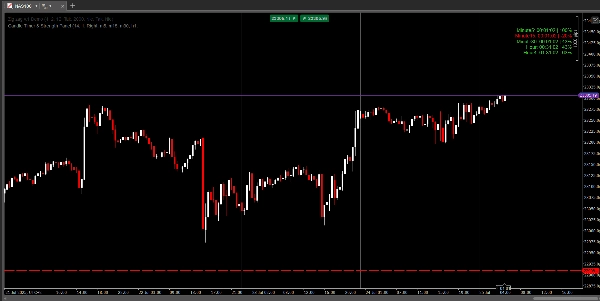
- Superposición fija del panel:
-
- El temporizador y la fuerza para cada marco temporal seleccionado siempre son visibles en un solo panel fácil de leer en la parte superior de tu gráfico.
- Elige la posición del panel: izquierda, centro o derecha.
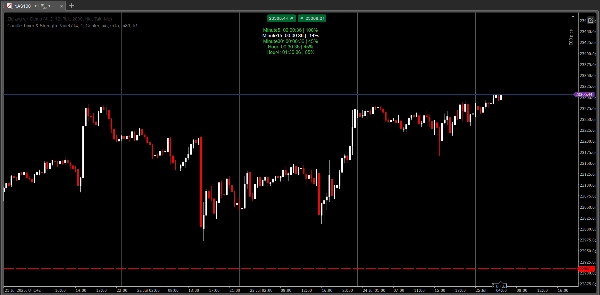
- Temporizadores de velas multimarco temporal:
-
- Ve la cuenta regresiva para el cierre de la próxima vela en hasta 5 marcos temporales seleccionados.
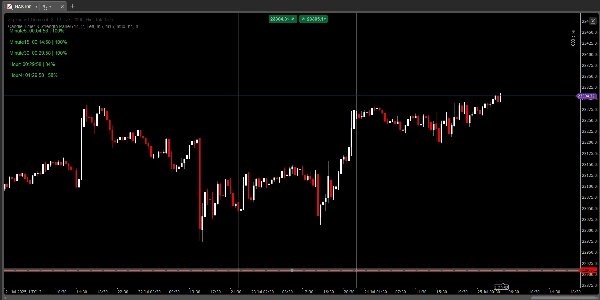
- Fuerza de la vela en %:
-
- Visualiza instantáneamente la fuerza de la vela actual (de -100% a +100%) para cada marco temporal, basado en dónde está el cierre en relación con el rango de la vela.
- Codificación de color dinámica: verde para fuerte alcista, rojo para fuerte bajista, blanco para neutral.
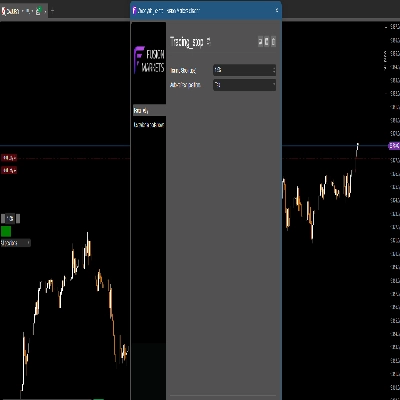
- Visualización personalizable:
-
- Configura el tamaño de fuente, el espaciado vertical y la posición del panel.
- Elige tus marcos temporales preferidos (M1, M5, M15, M30, H1, H4, etc.).
- Parámetro Hora de inicio H4 para brokers con velas H4 no estándar.
- Perfecto para:
-
- Scalpers y daytraders que necesitan un temporizador y momentum precisos de las velas de un vistazo.
- Traders multimarco temporal que quieren un panel limpio y siempre visible.
- Cualquiera que quiera mejorar su sincronización de entrada/salida y habilidades de lectura de velas.
¿En qué se diferencia esto del temporizador y fuerza estándar de velas?
- Versión panel:
-
- Todos los temporizadores y fuerzas se muestran en un panel fijo en la parte superior del gráfico (no junto a las velas).
- El panel no se mueve ni desaparece cuando haces zoom o desplazas – siempre está en el mismo lugar.
- Más fácil de leer y más profesional para la toma rápida de decisiones y análisis multimarco temporal.
- Versión estándar:
-
- Los temporizadores y fuerzas se muestran junto a la última vela en el gráfico y pueden moverse o superponerse con la acción del precio cuando haces zoom o desplazas.
Parámetros:
- Espaciado vertical (líneas)
- Posición horizontal del panel (izquierda, centro, derecha)
- Marco temporal 1–5 (personalizado)
- Hora de inicio H4 (para brokers con velas H4 no estándar)
¿Por qué elegir el Panel de Temporizador de Velas y Fuerza?
- Siempre ve los datos más importantes de tiempo y momentum – sin importar cómo hagas zoom o desplaces.
- Perfecto para trading multimarco temporal y de ritmo rápido.
- Aspecto limpio, moderno y profesional.
- Fácil de usar, totalmente personalizable y ligero.
¡Prueba el Panel de Temporizador de Velas y Fuerza y lleva tu trading multimarco temporal al siguiente nivel!
Ve todos mis indicadores y bots:
https://ctrader.com/pl?search=kobud.222&u=kobud.222
http://www.youtube.com/@Robi22-22
📩 ¿Preguntas? ¿Sugerencias? ¿Descuento?
Contacto disponible en mi perfil: Robikobud


![Logotipo de "[Hamster-Coder] Pivot Points MTF"](https://cdn.ctrader.com/image/webp/4c143e5a-309c-40e3-a578-f04d1e133ffa_31159)