Descripción
🚀 Más de 10,000 traders ya usan nuestros PRINCIPALES indicadores🏆
👉 Obtén todos nuestros sistemas TOP aquí:
_______________________________________________
📌 Indicadores de Estructura de Mercado
· ✅ AdvancedMarket Structure: Bos, Choch, SwinLevels, Order Blocks, Market Structure& Liquidity Finder
· 🔄 Análisis Dinámico de la Estructura de Mercado de Puntos de Giro
· 🧱 Bloque de Orden
· ⛓️ BOS & CHOCH
· 🧠 ICT Power of 3
· 🌀 Zonas de Polaridad de Mercado
_______________________________________________
🔚 Sistemas Inteligentes de Salida
· 📍 Algoritmo Inteligente de Seguimiento
_______________________________________________
📐 Indicadores ZigZag
· 🔍 Proyección de Liquidez de Precio ZigZag
· ➖ ZigZag
· 🎯 Rastreador de Extremos Zig-Zag
_______________________________________________
🧱 Indicadores de Soporte y Resistencia
· 🟩 Líneas de Soporte y Resistencia SmartTrend
· 🧱 Todos los Niveles de Soporte y Resistencia
_______________________________________________
📊 Indicadores de Tendencia y Canal
· 🔄 Canal de Tendencia Automático
· 📊 Supertrend
· ⚡Analizador de Tendencia Momentum
· 🧠 Canal de Tendencia Adaptativo
· 💥 Sistema de Ruptura de Canal
· 🌈 Gradiente de Tendencia Dinámico
_______________________________________________
💧 Herramientas de Volumen y Liquidez
· 📉 Mapa de Liquidación por Apalancamiento
· 🔍 Brecha de Valor Justo Momentum
· 🕒 Sesiones de Brecha de Valor Justo
_______________________________________________
⚡ Indicadores de Momentum y RSI
· 📈 Disparador de Tendencia RSI
· 🚀 Momentum de Rango Dinámico
· 🔎 Sesgo de Vela Multi-Nivel
Rastreador
_______________________________________________
🔮 Herramientas de Predicción y Proyección
· 📐 Predicción Basada en Linreg& ATR
· 📏 Regresión Lineal Fibonacci Multi-timeframe
· 📈 Proyector de Flujo de Mercado Potenciado por Volumen
Oferta y Demanda Automática: 💹
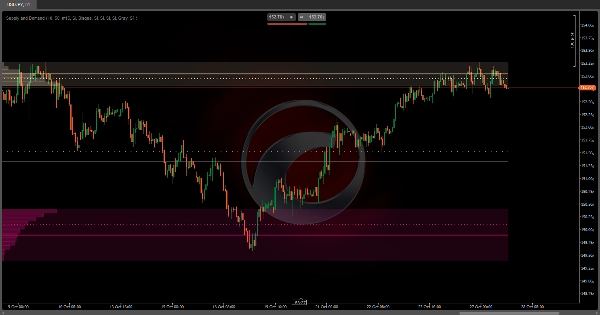
Oferta y Demanda Automática es un indicador avanzado de análisis de volumen que identifica automáticamente las zonas de mayor actividad comercial en tu gráfico. 📊 A diferencia de otros indicadores estáticos, este se ajusta dinámicamente al rango visual que estás observando, recalculando las zonas cada vez que haces zoom o desplazas el gráfico.
¿Cómo funciona? ❓
El algoritmo divide el rango de precios visible en múltiples niveles horizontales (configurables de 2 a 500 divisiones) y analiza el volumen negociado en cada nivel. Para lograr mayor precisión, utiliza datos de un marco temporal inferior al que estás observando. 🕒 Por ejemplo, si estás viendo un gráfico de 1 hora, puede analizar velas de 15 minutos para detectar con más detalle dónde se concentró realmente el volumen.
El Proceso de Identificación 🔍
El indicador trabaja desde los extremos hacia el centro:
- Desde el precio más alto: 🚀 Comienza en el máximo del rango visible y desciende nivel por nivel, acumulando el volumen negociado en cada banda de precio.
- Desde el precio más bajo: 📉 Simultáneamente, asciende desde el mínimo, acumulando volumen en dirección ascendente.
- Umbral de activación: ⚡ Cuando alguna de estas zonas acumula un porcentaje específico del volumen total (configurable, 10% por defecto), se marca como zona significativa y la búsqueda en esa dirección se detiene.
- Zona media: ⚖️ Una vez identificadas ambas zonas (superior e inferior), el espacio intermedio se marca como zona neutral o de equilibrio.
¿Para qué sirve? 🎯
Este indicador es una herramienta de análisis de estructura de mercado que te ayuda a:
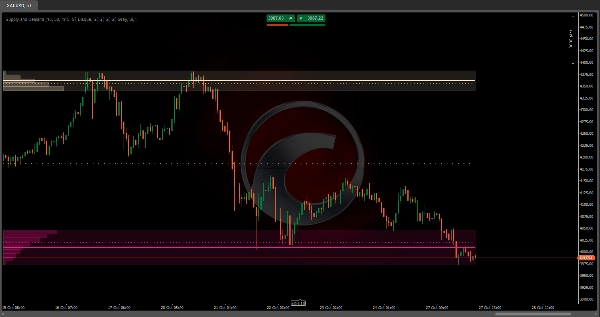
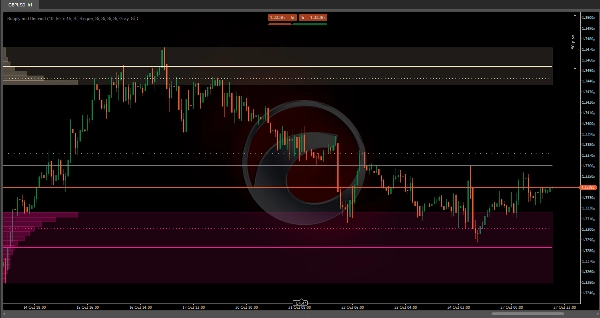
- Identificar zonas de oferta: 🏔️ Áreas superiores donde históricamente hubo alta actividad de venta.
- Identificar zonas de demanda: 🏖️ Áreas inferiores donde se concentró la actividad de compra.
- Detectar zonas de equilibrio: 🎭 El rango medio donde la presión de compra y venta se equilibran.
Estas zonas tienden a actuar como imanes para el precio en el futuro, ya que representan niveles donde muchos participantes tomaron posiciones. 🧲
¿Cómo se puede combinar? 🔗
Con estrategias de acción del precio:
- Espera retests de las zonas identificadas para buscar confirmaciones de reversión.
- Usa las zonas como objetivos de toma de ganancias o colocación de stop-loss.
Con indicadores de tendencia:
- En una tendencia alcista, busca entradas cuando el precio haga retest de la zona inferior de demanda. 📈
- En una tendencia bajista, usa la zona superior de oferta como resistencia para ventas. 📉
Con análisis de múltiples marcos temporales:
- Identifica zonas en marcos temporales superiores y busca confirmaciones en marcos temporales inferiores.
- Las zonas de un marco temporal superior pueden contener múltiples zonas en marcos temporales inferiores.
Con indicadores de momentum:
- Combina con RSI o Estocástico para confirmar condiciones de sobrecompra/sobreventa en las zonas.
- Divergencias en las zonas de oferta/demanda pueden señalar posibles reversiones.
Configuración Personalizable ⚙️
El indicador te permite ajustar completamente cada zona de forma independiente:
- Activar/desactivar cada elemento visual (áreas, líneas promedio, líneas ponderadas).
- Umbral de volumen: Qué porcentaje del volumen total debe acumularse para considerar una zona significativa.
- Divisiones de precio: Mayor número = mayor precisión pero más cálculos.
- Marco temporal inferior: Define la granularidad del análisis de volumen.
Característica Clave: Adaptación Automática 🔄
Recalculo automático basado en tu vista. Esto significa que:
- Si haces zoom para ver el detalle de una sesión, identificará las zonas específicas de oferta y demanda para esas horas.
- Si alejas el zoom para ver semanas o meses, recalculará las macro zonas para todo el período.
- Cada vez que desplaces el gráfico, las zonas se actualizan para reflejar el contexto del rango visible.
Resumen
The indicator divides the visible price range into configurable horizontal levels (2 to 500 divisions) and analyzes volume traded at each level using data from a lower timeframe than the chart’s timeframe for enhanced accuracy. It identifies significant zones by accumulating volume from the highest and lowest visible prices until a configurable volume threshold (default 10%) is reached, marking these as supply and demand zones respectively. The area between these zones is designated as a balance zone, representing equilibrium between buying and selling pressures.
These zones highlight areas of historically high trading activity that often act as future price magnets. The indicator supports customization of visual elements, volume thresholds, price divisions, and analysis timeframe. It can be combined with price action strategies, trend indicators, multiple timeframe analysis, and momentum indicators like RSI or Stochastic to improve trade entries, exits, and confirmations.
Supported markets include Forex, Indices, Commodities, Stocks, and Cryptocurrencies, with symbols such as EURUSD, GBPUSD, BTCUSD, XAUUSD, and NAS100.
Valoraciones de clientes
5 | 50 % | |
4 | 0 % | |
3 | 0 % | |
2 | 0 % | |
1 | 50 % |