Descripción
Indicadores de Pinescriptlabs Store: Pinescriptlabs Store cBots : (cBot) Gold & BTC BreakoutSession Pivots(nuevo)
PRICE ACTION (Nuevo)
Mapa de Liquidación de Apalancamiento
Predicción Basada en Linreg & ATR
Soporte y Resistencia SmartTrend
Líneas
Sesiones de Brecha de Valor Justo
Dinámica
Estructura del Mercado
Análisis
de
Puntos
de Giro
Fibonacci
Regresión
Lineal
Multitemporal
Brecha de Valor Justo de Momentum
Proyección del Flujo del Mercado
Gradiente de Tendencia Dinámico
Rastreador de
Sesgo de Velas
Multinivel
Rastreador de Extremos Zig-Zag
Líneas de
Tendencia de Soporte y
Resistencia
Automáticas
Todos
Los Niveles de
Soporte y Resistencia
Disponibles
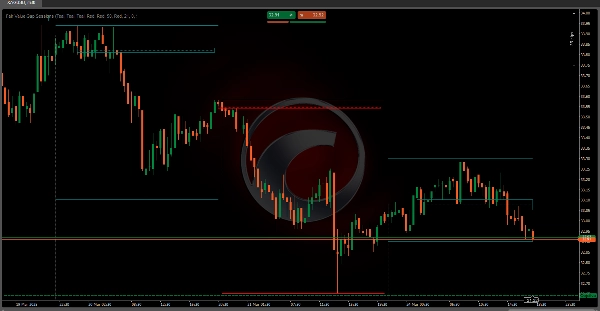
Sesiones de Brecha de Valor Justo 📊💰
El indicador de Brecha de Valor Justo (FVG) es una herramienta de trading sofisticada diseñada para identificar y resaltar ineficiencias temporales del mercado conocidas como "brechas de valor justo" 🚨 dentro de sesiones de trading específicas. Estas brechas representan momentos en los que el precio del mercado se mueve rápidamente ⚡, creando un desequilibrio entre compradores y vendedores.
Mecanismos Técnicos Clave 🔧
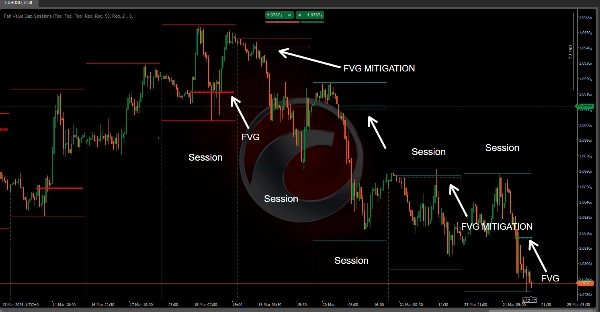
Arquitectura Basada en Sesiones 🕒
• Implementa un enfoque preciso y configurable de análisis basado en sesiones
• Permite a los traders definir horas de inicio de sesión personalizadas con soporte para zona horaria UTC o local 🌍
• Crea un límite dinámico de sesión que se reinicia y rastrea el comportamiento del mercado 🔄
Lógica de Detección de Brechas de Valor Justo 🔎
• Utiliza análisis avanzado de acción del precio a través de múltiples barras de precio consecutivas
• Identifica brechas comparando:
o Precios máximos y mínimos de barras consecutivas 📈📉
o Precio de cierre de la barra anterior ✅
o Estructura de precio de la barra actual 🔄
Clasificación de Brechas 🏷️
El indicador distingue entre dos tipos principales de brechas:
- Brecha de Valor Justo Alcista 📈
o Ocurre cuando el precio salta por encima del máximo anterior 🔺
o Indica un potencial impulso alcista del mercado 🚀
o Señala posible presión de compra 💸 - Brecha de Valor Justo Bajista 📉
o Ocurre cuando el precio cae por debajo del mínimo anterior 🔻
o Sugiere un potencial impulso bajista del mercado ⬇️
o Señala posible presión de venta 🛑
Aplicaciones de Trading 📱💼
Perspectivas Estratégicas 💡
• Ayuda a los traders a visualizar ineficiencias del mercado 🖼️
• Proporciona advertencia temprana de posibles reversiones de tendencia ⚠️
• Ofrece identificación precisa de puntos de entrada y salida 🎯
Características de Gestión de Riesgos 🛡️
• Visualización codificada por colores de estados de brecha 🎨
• Rastrea la "mitigación" de la brecha (cuando el precio regresa a la zona de la brecha) ↔️
• Permite configuraciones de color personalizables para diferentes condiciones del mercado 🎨
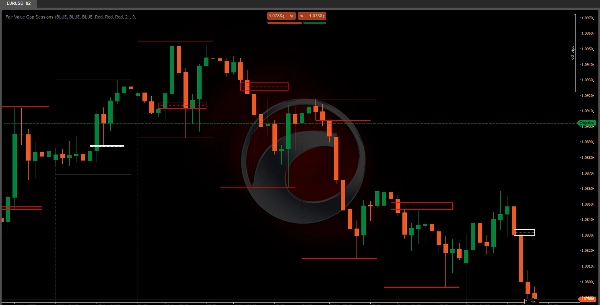
Visualización Técnica 🎨
El indicador crea dos elementos visuales principales:
- Rectángulo de Área de Brecha 🟩
o Representa el rango de precio de la brecha identificada 📐
o Se extiende dinámicamente durante toda la sesión de trading ➡️
o Cambia de color según el estado de la brecha (activa/mitigada) 🟩➡️🟨 - Línea de Nivel 📏
o Posicionada en el punto medio de la brecha ⚫
o Ayuda a los traders a identificar rápidamente la zona central de precio de la brecha 📍
o Usa diferentes estilos de línea para indicar el estado de la brecha ➔
Estrategias Prácticas de Trading 📝
Estrategias de Señal de Entrada 🚦
• Usar la detección de brechas como señal potencial de continuación de tendencia 🔄
• Buscar que el precio regrese a (mitigue) la brecha como confirmación ✅
• Combinar con otros indicadores técnicos para una toma de decisiones robusta 🤝
Técnicas de Gestión de Riesgos 🛡️
• Establecer stop-loss cerca de los límites de la brecha ⛔
• Usar el punto medio de la brecha como nivel potencial de soporte/resistencia 🪜
• Monitorear la mitigación de la brecha como indicador potencial de reversión de tendencia ↔️⚠️
Flexibilidad de Configuración ⚙️
• Hora de inicio de sesión personalizable ⏰
• Configuración de zona horaria (UTC/Local) 🌍
Al comprender e implementar correctamente el indicador de Sesiones de Brecha de Valor Justo, los traders pueden obtener una visión más profunda de la dinámica del mercado, identificar oportunidades potenciales de trading y tomar decisiones más informadas basadas en ineficiencias de la acción del precio. 🧠📈
Resumen
It classifies gaps into two types: bullish gaps, indicating potential upward momentum and buying pressure, and bearish gaps, signaling possible downward momentum and selling pressure. Visually, it represents gaps with dynamic rectangles showing the price range and a midpoint level line to help traders quickly locate the gap's central price zone. Colors and line styles change to reflect the gap's active or mitigated status.
Traders can use this tool to visualize market inefficiencies, receive early warnings of trend reversals, and identify precise entry and exit points. Risk management features include color-coded gap states, tracking of gap mitigation when price returns to the gap zone, and customizable color settings. The indicator supports practical strategies such as using gap detection for trend continuation signals and combining it with other indicators for decision-making. Stop-loss placement near gap boundaries and monitoring gap mitigation for trend reversal are also supported.
Valoraciones de clientes
5 | 100 % | |
4 | 0 % | |
3 | 0 % | |
2 | 0 % | |
1 | 0 % |