Deskripsi
Indikator Toko Pinescriptlabs: 🤖Pinescriptlabs Store cBots : (cBot) Gold & BTC BreakoutSession Pivots(baru)
Prediksi Berdasarkan Linreg & ATR
SmartTrend Dukungan &
Perlawanan
Garis
Analisis
Struktur Pasar
Dinamis
dari
Titik
Pembalikan
Fibonacci
Regresi
Linear
Multi-timeframe
Pelacak
Bias Lilin
Multi-Level
Tracker
Otomatis
Dukungan dan
Perlawanan
Garis
Lines
Semua
Dukungan dan
Perlawanan
Level
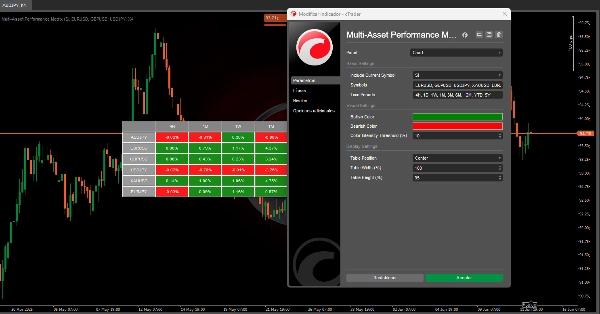
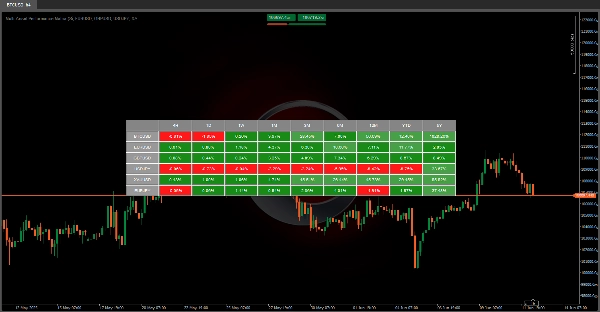
🚀 MATRIKS KINERJA MULTIASSET 🚀
Algoritma ini adalah alat visual yang kuat 📊 yang dirancang untuk menampilkan persentase kinerja dari berbagai instrumen keuangan dalam berbagai periode waktu.
Ini mengubah data historis menjadi visualisasi yang efisien dan intuitif, memungkinkan pengguna untuk dengan cepat menilai perilaku berbagai aset keuangan.
❓ Apa Fungsi Alat Ini?
1️⃣ 📈 Membandingkan Aset: Menampilkan bagaimana harga berbagai instrumen keuangan (seperti BTCUSD, EURUSD, XAUUSD, dll.) telah berubah dari waktu ke waktu.
- Kerangka waktu: D (Harian) | 1M (Mingguan) | 1B (Bulanan) | 3B (Triwulanan) | 6B (Setengah Tahunan) | 12B (Tahunan) | YTD (Tahun Berjalan) | 5T (5 Tahun Terakhir)
2️⃣ 🎨 Menyoroti Tren: Menggunakan kode warna (🟢, 🔴 ) untuk langsung mengidentifikasi aset mana yang naik atau turun di setiap periode.
3️⃣ ⏱️ Pembaruan Otomatis: Memperbarui data setiap menit untuk mencerminkan informasi pasar terbaru.
💡 Mengapa Ini Berguna?
✔ 📊 Analisis Perbandingan: Memungkinkan perbandingan berdampingan dari berbagai aset—ideal untuk manajemen portofolio atau memilih aset dengan kinerja terbaik berdasarkan horizon waktu.
✔ 🛡️ Kontrol: Mengevaluasi konsistensi (atau volatilitas) aset di berbagai periode membantu menilai risiko terkait.
✨ Kunci
✅ ⏳ Menghemat Waktu: Mengumpulkan dan menghitung data ini secara manual akan memakan jam—alat ini melakukannya secara instan!
✅ 👀 Visual yang Jelas: Sistem berkode warna membuat analisis mudah, bahkan untuk pengguna non-teknis.
✅ 🔄 Adaptif: Mendukung simbol kustom, sehingga Anda dapat melacak aset yang penting bagi Anda.
Ringkasan
Ulasan pelanggan
5 | 100 % | |
4 | 0 % | |
3 | 0 % | |
2 | 0 % | |
1 | 0 % |