

Deskripsi
Indikator Toko Pinescriptlabs: Toko Pinescriptlabs cBots : (cBot) Gold & BTC BreakoutSession Pivots(baru)
Struktur Pasar Lanjutan: Bos, Choch, SwinLevels, Order Blocks, Pencari Struktur Pasar & Likuiditas (Baru)
Proyeksi Likuiditas Harga ZigZag
Algoritma Pintar Trailing (baru)
Prediksi Berdasarkan Linreg & ATR
SmartTrend Dukungan &
Perlawanan
Garis
Dinamis
Analisis Struktur Pasar
dari
Titik
Pembalikan
Fibonacci
Regresi
Linear
Multi-timeframe
Multi-Level
Pelacak Bias Lilin
Tracker
Otomatis
Dukungan dan
Perlawanan
Garis Tren
Lines
Semua
Dukungan dan
Perlawanan
Level
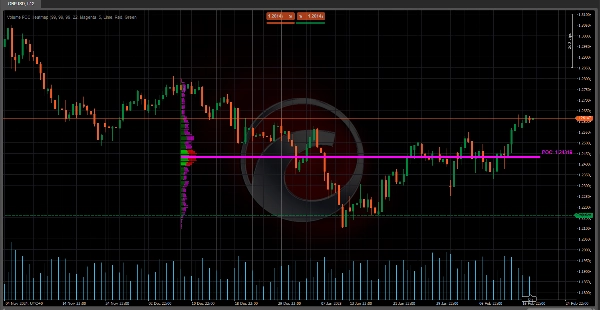
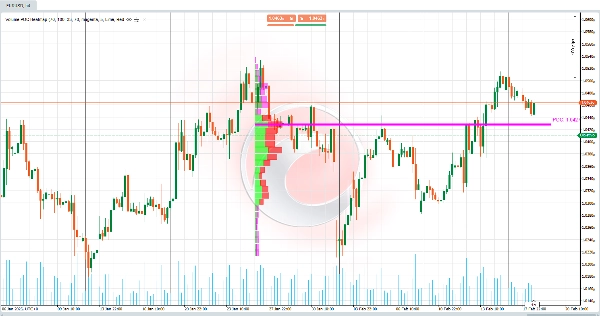
🔥 Peta Panas Volume POC 🔥
Indikator ini adalah Profil Volume yang menampilkan distribusi volume perdagangan di berbagai level harga selama periode tertentu. Tujuan utamanya adalah mengidentifikasi zona dukungan/perlawanan utama dan area di mana pasar menunjukkan minat terbesar (aktivitas beli/jual tinggi). Ini sangat berguna untuk:
- Mendeteksi Titik Kontrol (POC) 🎯
Level harga dengan volume tertinggi, bertindak sebagai magnet untuk aksi harga. - Memvisualisasikan Area Nilai (VA)
Zona di mana persentase tertentu dari total volume terkonsentrasi (misalnya, 70%), menunjukkan keseimbangan antara pembeli dan penjual. - Membedakan Volume Bullish dan Bearish 📈📉
Menunjukkan di mana kekuatan beli vs. tekanan jual terkumpul.
🧠 Logika & Perhitungan Utama 🔢
- Pembagian Rentang Harga 📏
-
- Rentang harga (dari yang terendah hingga tertinggi dalam B Bars terakhir) dibagi menjadi Sel Volume (CNum) .
Contoh: Jika CNum = 33 , rentang dibagi menjadi 33 level yang sama jaraknya.
- Rentang harga (dari yang terendah hingga tertinggi dalam B Bars terakhir) dibagi menjadi Sel Volume (CNum) .
- Distribusi Volume per Level 📊
-
- Untuk setiap bar dalam data historis:
-
- Volume yang terkait dengan badan (selisih antara buka dan tutup) dan sumbu (tinggi dan rendah) dihitung.
- Volume didistribusikan secara proporsional ke sel harga yang dilintasi oleh bar.
Contoh: Jika bar hijau (bullish) mencakup 3 sel, volume terutama dialokasikan ke sel tersebut sebagai "volume bullish."
- Perhitungan Titik Kontrol (POC) 🎯
-
- POC adalah sel dengan volume terakumulasi tertinggi, mewakili harga di mana terdapat konsensus terbanyak antara pembeli dan penjual.
- Perhitungan Area Nilai (VA) 🔄
-
- Meluas dari POC ke atas/bawah hingga mencakup % tertentu dari total volume (misalnya, 70%).
Contoh: Jika VA berkisar dari 100 hingga 105 , berarti 70% volume diperdagangkan dalam rentang tersebut.
- Meluas dari POC ke atas/bawah hingga mencakup % tertentu dari total volume (misalnya, 70%).
- Normalisasi Visual 🖼️
-
- Volume diskalakan menggunakan Faktor Skala untuk menyesuaikan lebar bar pada grafik, memudahkan visualisasi.
🛠️ Kunci Peta Panas Volume POC 💡
- Kurangnya Konteks pada Indikator Volume Tradisional 🤔
Indikator volume klasik (seperti volume per bar) tidak menunjukkan di mana volume diperdagangkan. Indikator ini memetakan volume berdasarkan level harga, menyelesaikan masalah tersebut. - Identifikasi Dukungan/Perlawanan Organik 🚀
Zona dengan volume tinggi bertindak sebagai dukungan/perlawanan dinamis, lebih dapat diandalkan daripada garis statis. - Deteksi Ketidakseimbangan ⚖️
Area dengan volume bullish atau bearish dominan menandakan potensi breakout atau pembalikan.
💡 Penggunaan Praktis dalam Trading 📈
- POC sebagai Zona Minat 🎯
-
- Jika harga mendekati POC, harapkan reaksi seperti pantulan atau konsolidasi.
- Area Nilai (VA) sebagai Zona Keseimbangan 🔄
-
- Jika harga berada di luar VA, cenderung kembali ke sana (efek magnet).
- Jika harga berada di dalam VA, mungkin menandakan konsolidasi.
- Volume Bullish/Bearish sebagai Konfirmasi 🔍
-
- Lonjakan volume bullish di resistance menunjukkan potensi breakout.
- Volume bearish tinggi di support menunjukkan kemungkinan breakdown.
🌟 Contoh 📊
Parameter yang Digunakan (Terlihat & Dapat Dikonfigurasi oleh Pengguna):
- Bars Back = 55 → Jumlah bar historis yang dianalisis.
- Sel Volume = 33 → Jumlah pembagian/sel dalam rentang harga.
- Persentase Volume Area Nilai = 70 → Persentase volume yang mendefinisikan Area Nilai.
Situasi:
- Harga menembus level dukungan teknis, tetapi volume di zona tersebut rendah (menurut profil).
- Kemudian, harga kembali ke Area Nilai (VA) yang didefinisikan oleh 70% dari total volume.
Interpretasi:
- Breakout tersebut palsu (karena volume rendah di zona breakout).
- Pasar berusaha menyeimbangkan kembali dalam Area Nilai , di mana aktivitas lebih tinggi (kepadatan volume tinggi).
Tindakan:
- Cari peluang beli di dekat batas bawah VA atau POC, karena ini adalah zona minat tinggi bagi pelaku pasar.
Ringkasan
Key functionalities include:
- Division of the price range into multiple volume cells for detailed volume mapping.
- Calculation of POC as the volume consensus price.
- Determination of the Value Area around the POC.
- Visual normalization of volume bars for clearer chart representation.
This tool addresses the limitation of traditional volume indicators by showing where volume was traded rather than just total volume per bar. It helps identify dynamic support and resistance zones based on volume concentration and detects volume imbalances that may signal potential breakouts or reversals. Traders can use it to anticipate price reactions near the POC and VA, aiding in decision-making for entries and exits. Configurable parameters include the number of historical bars analyzed, volume cells, and the percentage defining the Value Area.
Ulasan pelanggan
5 | 100 % | |
4 | 0 % | |
3 | 0 % | |
2 | 0 % | |
1 | 0 % |


![Logo "Tabajara corrigido[fix]"](https://cdn.ctrader.com/image/webp/7f4bbef8-b245-4ebd-80d7-582fffc0c90c_28378)

![Logo "[Hamster-Coder] Moving Average MTF"](https://cdn.ctrader.com/image/webp/b11b98b1-194d-4b8e-b00e-d611826ad159_31226)


