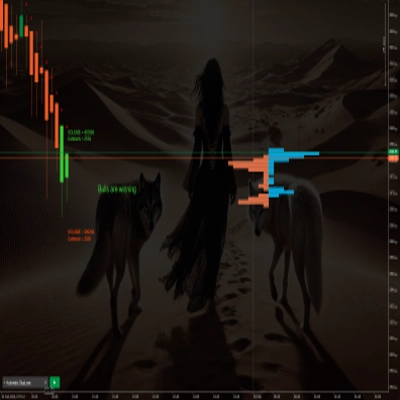
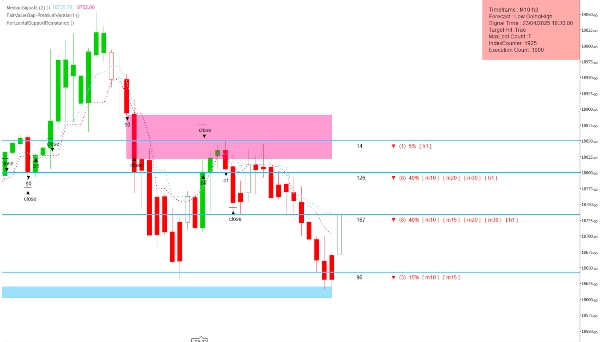
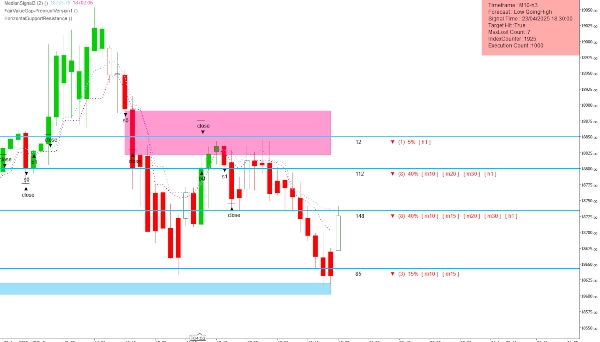
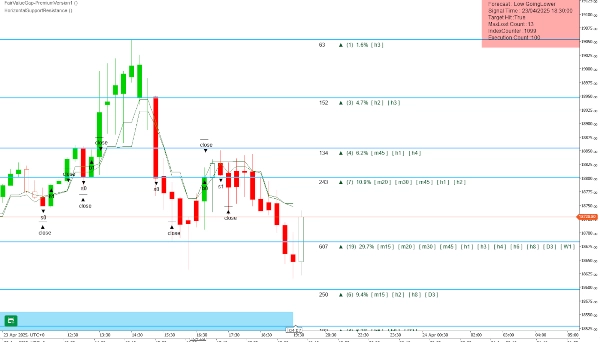
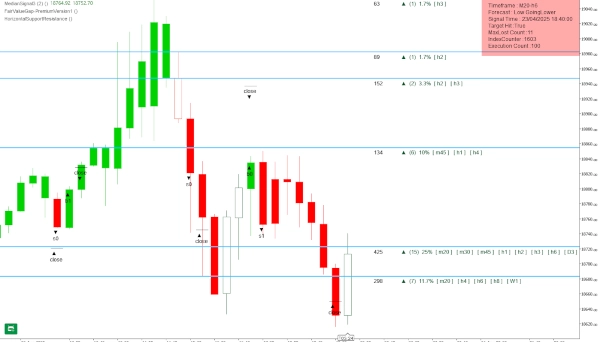
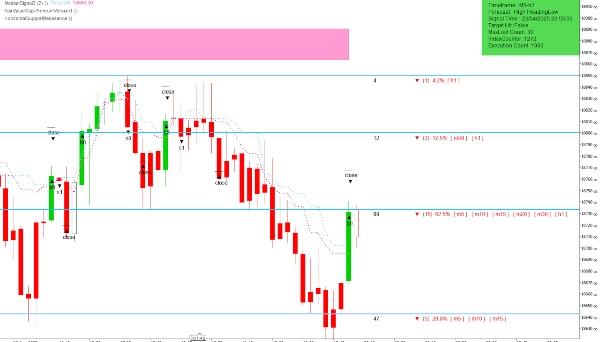
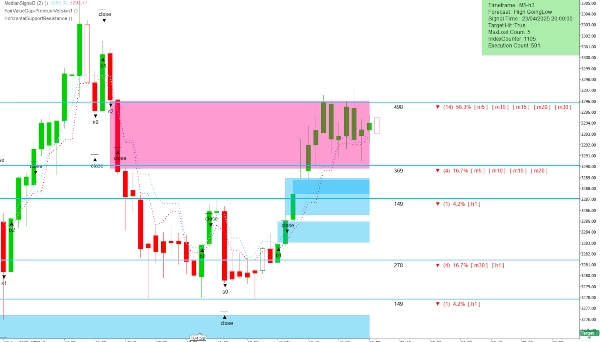
Broker & Prop
Untuk bisnis
00
Days
:
00
Hours
:
00
Minutes
:
00
Seconds
Indikator
Indices
Stocks
Forex
GBPUSD
Scalping
HorizontalSupportResistance
4.5
03/09/2025
463
Desktop
Sejak 19/04/2025
Volume trading
284.2M
Pip dimenangkan
1.07M
Penjualan
7
Instal gratis
1936
Gambar unggahan "HorizontalSupportResistance"Gambar unggahan "HorizontalSupportResistance"Gambar unggahan "HorizontalSupportResistance"Gambar unggahan "HorizontalSupportResistance"Gambar unggahan "HorizontalSupportResistance"Gambar unggahan "HorizontalSupportResistance"

This extraordinary multi timeframe support and resistance indicator is nothing short of market wizardry. Designed with precision and backed by smart logic, it identifies critical price levels on all forex, indices, or stocks but especially on the NASDAQ100 with uncanny accuracy. Like a seasoned trader’s intuition encoded into a visual tool, it highlights key zones where price reacts, reverses, or accelerates—giving you an edge that feels almost supernatural. With clean candlestick representation and vibrant, clearly marked levels, this indicator doesn’t just follow the market—it anticipates it. Whether you're scalping short-term moves or holding longer-term positions, this tool acts like your personal trading oracle, quietly guiding you to smarter, more confident decisions.

4.5
Ulasan: 2
5
50 %
4
50 %
3
0 %
2
0 %
1
0 %
Ulasan pelanggan
August 12, 2025
Pros: Accurate auto SR levels, customizable appearance, lightweight. Cons: No level strength filter, no alerts, possible chart clutter.
June 20, 2025
The Indicator is excellent, What's the core logic of this Indicator, Kindly share if you don't mind.
Produk lain dari penulis ini
Peringkat teratas
Gratis
FairValueGap
This Fair Value Gap (FVG) indicator is a technical analysis tool used to identify potential price imbalances.
Indikator
Signal
FairValueGap-PremiumVersion1
This Fair Value Gap (FVG) indicator is a technical analysis on multi-timeframe.
Peringkat teratas
Gratis
BarSentiments
This Indicator is a technical analysis tool that measures the strength and direction of market sentiment
Anda mungkin juga suka
Indikator
NAS100
NZDUSD
XAUUSD
+11
TradingView ATR
Upgrade to ATR-RMA! Experience the precise ATR using Relative Moving Average for accurate volatility analysis in cTrader
Indikator
NAS100
RSI
NZDUSD
+19
Bounty stop
the indicator that hunts stop-loss liquidity before the big players do.
Indikator
Indices
RSI
Stocks
+5
REDGREENZONEREVERSAL
The Red & Green Zone Reversal Indicator detects overbought and oversold market conditions using Bollinger Bands and RSI.
Indikator
Indices
ATR
Stocks
+4
UT Bot Alert
A powerful ATR-based indicator generating clear BUY/SELL signals. Features real-time alerts and customizable sensitivity
Indikator
RSI
Breakout
ATR
+2
Channel Breakout System
🚀 Specialized algorithm is designed to confirm entry and exit points with precision 🎯
Indikator
Breakout
Fibonacci
Linear Regression Channel
Statistically-grounded trend channels via linear regression — clear trend & reversal zones.
VegaXLR - Auto Support and Resistance
cTrader Auto Support & Resistance detects key levels with Fibonacci analysis and sends real-time trading alerts.
Indikator
NAS100
NZDUSD
Martingale
+26
ICT Killzones
Complete ICT Killzones: 5 sessions, easy colors, transparency controls & session info. Professional timing for cTrader.
E7 Harmonic Structures Basic
E7 Harmonic Structures Basic.
Bollinger Bands Breakout Oscillator (+ Alerts)
BB Breakout Oscillator with alerts! Spot trend reversals using Bollinger Bands. Bullish/Bearish crossovers Alerts.
Indikator
Grid
NAS100
NZDUSD
+16
AllPattern
🔍 Discover All Candlestick Patterns
 Absolutely Free!
Indikator
RSI
XAUUSD
Breakout
+6
PREMIUM SSL CHANNEL
SSL Channel: Tracks trends 📈 measures volatility ⚡filters noise via ATR+SSL. Clear signals for precise entries/exit...
Indikator
NAS100
NZDUSD
Forex
+23
DailyMA
Daily moving averages, simplified. Displays 3 daily moving averages on lower timeframes with selectable MA types.
Daily Open Pivot Level
This indicator is a valuable tool for traders looking to identify significant opening price level of any asset.
Indikator
Indices
Stocks
Commodities
+2
Deviation-Scaled Moving Average
Momentum-adaptive MA: scales responsiveness via deviation — fast in trend, smooth in chop.
Indikator
Grid
RSI
Breakout
+12
Trend Pulse X
is a trend-following indicator designed to provide a clear view of market direction, momentum, and strength