
Heikin Ashi Candlestick
Wskaźnik
2 pobrania
Wersja 1.0, Sep 2025
Windows, Mac
Opis
Wskaźnik świec Heikin Ashi
Ten wskaźnik wyświetla świece Heikin Ashi bezpośrednio na Twoim wykresie.
Instalacja:
- Przeciągnij wskaźnik na wybrany wykres.
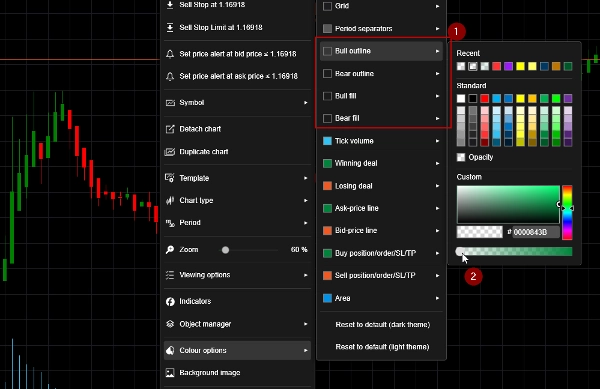
- Kliknij prawym przyciskiem myszy na wykres i wybierz „Opcje kolorów”.
- Ustaw Kontur byka, Wypełnienie byka, Kontur niedźwiedzia i Wypełnienie niedźwiedzia na „Przezroczysty”. Zobacz zrzut ekranu 1.
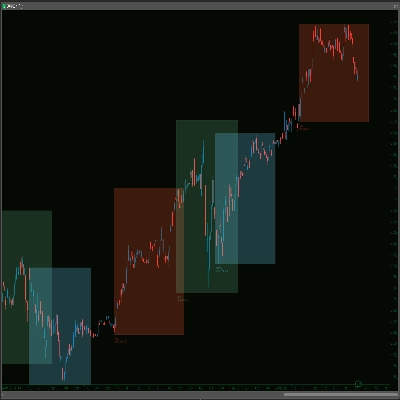
Aby wyświetlić świece Heikin Ashi bez wskaźników, zobacz zrzut ekranu 2.
Podsumowanie
Podsumowanie AI
The Heikin Ashi Candlestick indicator displays Heikin Ashi candles directly on trading charts. It modifies traditional candlestick visuals to provide a smoothed representation of price action, which can help in identifying trends more clearly. Installation involves dragging the indicator onto the desired chart and adjusting color settings to make the standard candle outlines and fills transparent, allowing the Heikin Ashi candles to be prominently displayed. This indicator is applicable across multiple markets including Forex, cryptocurrencies, and stocks. It integrates seamlessly with existing chart setups to enhance visual analysis without altering underlying price data.
Profil wskaźnika
Opinie klientów
0.0
Opinie: 0
Opinie klientów
Ten produkt nie ma jeszcze opinii. Wypróbowałeś(-aś) go już? Bądź pierwszy(-a) i powiedz o tym innym!
Dyskusja
Częste pytania
Forex
Crypto
Stocks
Produkty dostępne za pośrednictwem cTrader Store, w tym boty handlowe, wskaźniki i wtyczki, dostarczane są przez deweloperów zewnętrznych i udostępniane wyłącznie w celach informacyjnych oraz w celu zapewnienia dostępu technicznego. cTrader Store nie jest brokerem i nie zapewnia doradztwa inwestycyjnego, nie udziela spersonalizowanych rekomendacji ani nie gwarantuje przyszłych wyników.


![Logo „[Hamster-Coder] Pivot Points MTF”](https://cdn.ctrader.com/image/webp/4c143e5a-309c-40e3-a578-f04d1e133ffa_31159)


Cena
Od 15/06/2025
672
Bezpłatne instalacje