
Opis
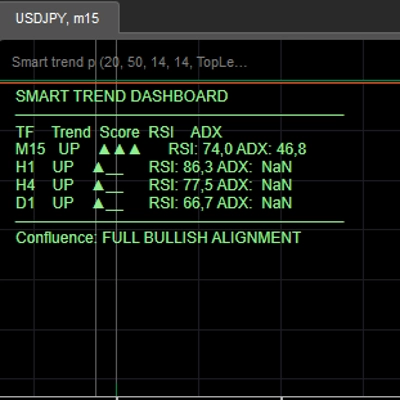
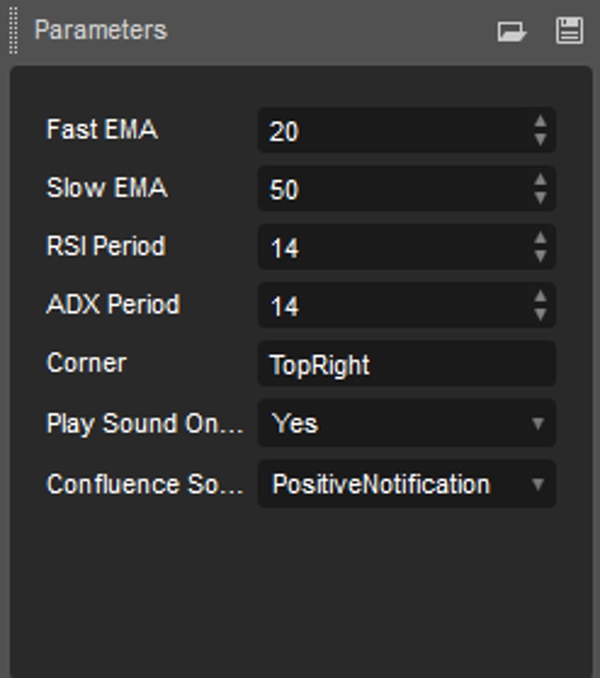
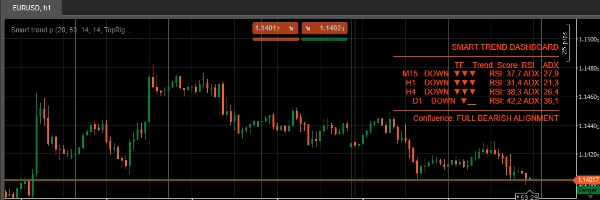
Przestań przełączać się między ramami czasowymi wykresu, aby sprawdzić, czy Twój trend faktycznie się utrzymuje. Smart Trend Dashboard skanuje jednocześnie M15, H1, H4 i D1 i daje Ci pojedynczy złożony wynik dla każdej ramy czasowej (-3 do +3), który łączy kierunek EMA, potwierdzenie DI+/DI- oraz momentum RSI — z filtrowaniem ADX eliminującym słabe, niestabilne trendy, dzięki czemu nie dajesz się zwieść szumowi.
Kluczowe funkcje:
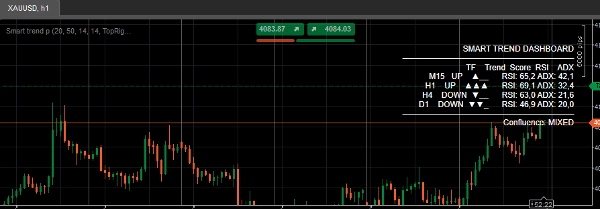
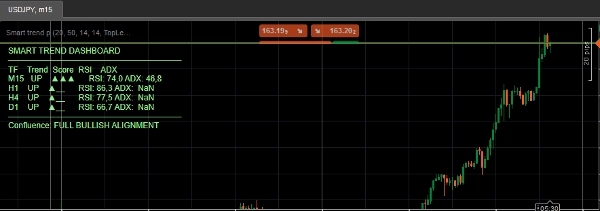
- Panel na żywo z wieloma ramami czasowymi (M15 / H1 / H4 / D1) bezpośrednio na Twoim wykresie
- Złożony wynik trendu dla każdej ramy czasowej — jedna liczba, a nie cztery wskaźniki do interpretacji
- Wizualne paski siły (▲▲▲ / ▼▼_) do natychmiastowego odczytu na pierwszy rzut oka
- Ocena z filtrem ADX — słabe/niestabilne trendy są automatycznie tłumione
- Pełne wykrywanie zgodności — sygnalizuje, gdy wszystkie ramy czasowe się zgadzają
- Dźwiękowy alert, gdy następuje pełna bycza/niedźwiedzia zgodność
- Panel kodowany kolorami (zielony = bycza zgodność, czerwony = niedźwiedzia, biały = mieszany)
- Lekki — bez przerysowywania, aktualizacje przy zamknięciu świecy
Dla kogo jest to przeznaczone:
Traderzy dyskrecjonalni i twórcy półautomatycznych systemów, którzy używają potwierdzenia wieloramowego przed wejściem w transakcje i chcą, aby ta kontrola była zautomatyzowana zamiast ręczna.
Podsumowanie
AI summary
Smart Trend Dashboard is a multi-timeframe indicator for cTrader that evaluates trend direction, momentum, and strength across four timeframes: M15, H1, H4, and D1. It provides a composite trend score ranging from -3 to +3 per timeframe, integrating EMA direction, DI+/DI- confirmation, and RSI momentum, while using ADX to filter out weak or choppy trends. The dashboard displays these scores visually with strength bars and color-coded panels (green for bullish, red for bearish, white for mixed), enabling quick assessment of market conditions without switching chart timeframes.
Key features include a live panel directly on the chart, ADX-gated scoring to reduce noise, full confluence detection that flags when all timeframes align, and sound alerts for complete bullish or bearish alignment. The indicator updates on bar close and does not repaint, making it suitable for discretionary traders and semi-automated system builders who rely on multi-timeframe confirmation before entering trades.
Key features include a live panel directly on the chart, ADX-gated scoring to reduce noise, full confluence detection that flags when all timeframes align, and sound alerts for complete bullish or bearish alignment. The indicator updates on bar close and does not repaint, making it suitable for discretionary traders and semi-automated system builders who rely on multi-timeframe confirmation before entering trades.
Profil wskaźnika
Kategoria wskaźnika
Trend
Typ wyjścia
Wizualizacja
Sygnały
Wymagania dotyczące danych
Tylko słupki
Obsługiwane sygnały
Siła trendu
Opinie klientów
0.0
Opinie: 0
Opinie klientów
Ten produkt nie ma jeszcze opinii. Wypróbowałeś(-aś) go już? Bądź pierwszy(-a) i powiedz o tym innym!
Dyskusja
Częste pytania
ADX
EMA
Supertrend
SMA
RSI
Moving Average
Produkty dostępne za pośrednictwem cTrader Store, w tym boty handlowe, wskaźniki i wtyczki, dostarczane są przez deweloperów zewnętrznych i udostępniane wyłącznie w celach informacyjnych oraz w celu zapewnienia dostępu technicznego. cTrader Store nie jest brokerem i nie zapewnia doradztwa inwestycyjnego, nie udziela spersonalizowanych rekomendacji ani nie gwarantuje przyszłych wyników.
Więcej od tego autora




Cena
Od 30/05/2026
1
Sprzedaż