

present
Zarejestruj się i otrzymaj 50 $ zniżki na pierwszy zakup
Trading product for Institutional Bubbles Wskaźnik Volume Market Structure, image 1
Institutional Bubbles
Wskaźnik
7 zakupy
Wersja 1.0, Apr 2026
Windows, Mac
4.5
Opinie: 2
Trading product for Institutional Bubbles Wskaźnik Volume Market Structure, image 2
Trading product for Institutional Bubbles Wskaźnik Volume Market Structure, image 3
Trading product for Institutional Bubbles Wskaźnik Volume Market Structure, image 4
Trading product for Institutional Bubbles Wskaźnik Volume Market Structure, image 5
Trading product for Institutional Bubbles Wskaźnik Volume Market Structure, image 6
Od 24/03/2026
13
Sprzedaż
115
Bezpłatne instalacje

Opis

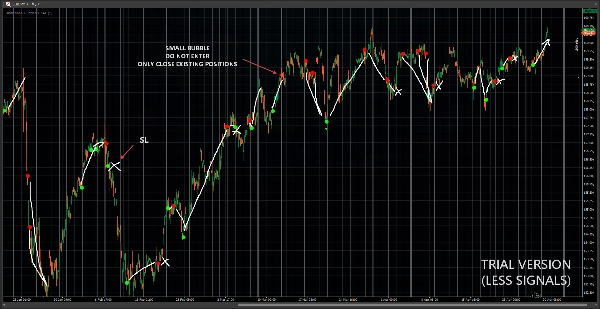
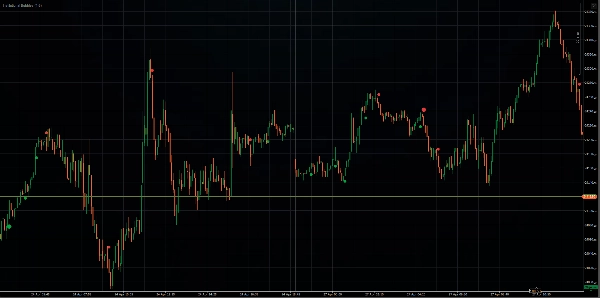
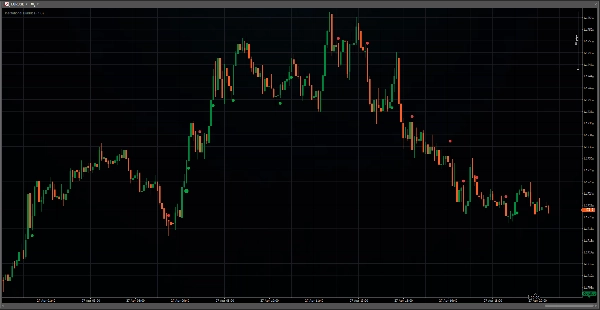
Institutional Bubbles koncentruje się na wykrywaniu udziału instytucjonalnego.

__ Aktywność instytucjonalna zmienia się w zależności od warunków płynności i kontekstu rynkowego. Aby temu sprostać, wskaźnik stosuje własny algorytm łączący normalizację opartą na lambda z ruchomym VWAP, aby wyizolować oczywiste wzorce nierównowagi. Celem nie jest podkreślanie i wykorzystywanie oczywistych podejrzanych sygnałów, lecz podkreślanie i wykorzystywanie sztucznie "normalnej" i zrównoważonej aktywności. __

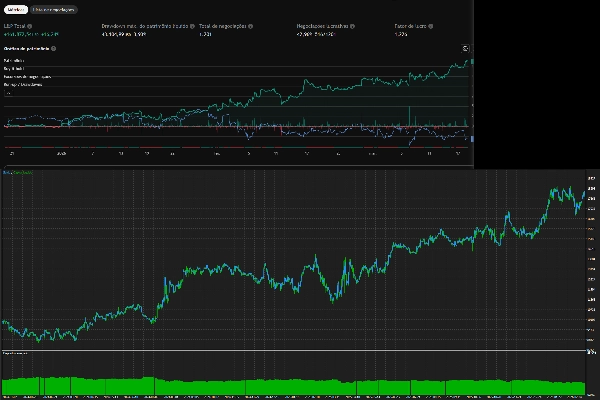
To jest w pełni skwantyfikowany system. Przeprowadziliśmy testy wsteczne na innych platformach i pokazały one, że ślepe podążanie za dużymi bąblami przynosi stałą przewagę, która została zweryfikowana na ponad 1000 transakcjach (test wsteczny podąża za kierunkiem sygnału i zamyka pozycję, jeśli pojawi się sygnał z przeciwnej strony, nie stosowano filtrów ani innych wskaźników). Dzięki stałej przewadze we wszystkich symbolach, ten wskaźnik jest idealny, aby podnieść twoją strategię na wyższy poziom, dając ci większą pewność przy wejściach.


* DOMYŚLNA KONFIGURACJA (CZUŁOŚĆ=1.6 LUB NIŻSZA) JEST NAJLEPSZA DLA KAŻDEGO SYMBOLE.
* WSZYSTKIE SYMBOLE I INTERWAŁY CZASOWE SĄ OBSŁUGIWANE, ALE ZALECA SIĘ UŻYWANIE M1 LUB M5 DLA NAJPRECZYZNIEJSZEGO ODCZYTU.

* NIE SPRZEDAJEMY AUTOMATYCZNYCH ALGORYTMÓW HANDLOWYCH.

Podsumowanie

AI summary
Institutional Bubbles is a trading indicator designed to detect and quantify institutional participation in the market by analyzing volume and price action patterns. It uses a proprietary algorithm that combines lambda-based normalization with a rolling Volume Weighted Average Price (VWAP) to isolate subtle, balanced trading activity rather than obvious imbalances. This approach aims to reveal hidden institutional trading signals that are typically "normal" in appearance but carry predictive value.

The indicator supports all symbols and timeframes, with a recommendation to use 1-minute or 5-minute charts for the most precise readings. Its default sensitivity setting (1.6 or lower) is optimized for broad applicability across markets. Institutional Bubbles provides fully quantified signals that have been backtested over 1000+ trades across multiple platforms, demonstrating a consistent edge when following the indicator’s directional signals without additional filters.

Key features include visualization of institutional activity, signal generation for breakouts, reversals, trend strength, volatility regimes, and support/resistance levels. It requires only bar data and is categorized under support and resistance indicators. This tool is intended to enhance trading strategies by offering insights into hidden market dynamics driven by large participants.
Profil wskaźnika
Kategoria wskaźnika
Wsparcie i opór
Typ wyjścia
Wizualizacja
Sygnały
Filtr
Wymagania dotyczące danych
Tylko słupki
Obsługiwane sygnały
Przełamanie
Odwrócenie trendu
Siła trendu
Zmienność
Przebicie poziomu
Dotknięcie poziomu

Opinie klientów

4.5
Opinie: 2
5
50 %
4
50 %
3
0 %
2
0 %
1
0 %
Opinie klientów
May 4, 2026

Dyskusja

Częste pytania

Volume
Market Structure
Supply & Demand
VWAP
Support & Resistance
Produkty dostępne za pośrednictwem cTrader Store, w tym boty handlowe, wskaźniki i wtyczki, dostarczane są przez deweloperów zewnętrznych i udostępniane wyłącznie w celach informacyjnych oraz w celu zapewnienia dostępu technicznego. cTrader Store nie jest brokerem i nie zapewnia doradztwa inwestycyjnego, nie udziela spersonalizowanych rekomendacji ani nie gwarantuje przyszłych wyników.

Więcej od tego autora

Wskaźnik
OBV
Volume
+2
Weis Wave indicator based on the original work of David Weis.
Wskaźnik
Volume
Order Block
+4
Volume Profile with fixed period, custom range and buy/sell pressure.
Logo „VA Footprint”
Najwyżej oceniane
4.5
(4)
od $19
Wskaźnik
SMC
Prop
+5
VA Footprint replaces your chart with a order flow one, the most precise way to read the market.
Wskaźnik
VWAP
Volume
+3
Don't trust static support and resistance levels, this indicator combines Fibonacci and VWAP in one powerful tool.

Możesz także polubić

Wskaźnik
Doji
Wedge
+5
Angora Pattern Recognition is a cTrader indicator that finds, draws and tracks classic chart patterns automatically.
Wskaźnik
ADX
ATR
+5
EMA-cross signals scored on six confluence layers, with an ATR stop, three targets and a live panel
Wskaźnik
Master RSI reversals with Parabolic SAR precision! Get real-time alerts for high-probability trend changes.
Wskaźnik
Prop
Forex
+9
Trend Sniper — session-based tool highlighting live session ranges and adaptive Custom line.
Wskaźnik
Risk Dashboard
AI-powered daily range forecasts help traders spot volatility opportunities and plan stops and targets.
Wskaźnik
ADX
ATR
+5
10 Factors. One Signal. Zero Guesswork.
Wskaźnik
AI
ATR
+27
The Fibonacci Automated Levels Indicator is a smart trading tool that automatically detects the most recent market.
Wskaźnik
ATR
VWAP
+4
Structure-aware indicator that re-anchors VWAP to confirmed swing pivots.
Wskaźnik
SMC
NAS100
+5
Rolling Volume Profile MTF with 24H, 7D, 30D profiles and a precise NY Open marker.
Wskaźnik
Volume
Imbalance
+1
Volume profile indicator that auto-detects the latest trendline. Shows POC, Value Area (VAH/VAL), and High Volume Nodes
Wskaźnik
CHOCH
Inducement
+5
TradeLens - Frame the Trade. Refine the Entry. Two Timeframes. One Decision.
Wskaźnik
EMA
RSI
+4
🚀📈 Plot buy/sell signals on Range Bars using Moving Averages and RSI. Clear, actionable trading insights.🚀📈
Wskaźnik
VWAP
Volume
+3
Don't trust static support and resistance levels, this indicator combines Fibonacci and VWAP in one powerful tool.
Wskaźnik
SMC
VWAP
+5
Smart ICT Concepts indicator from TV: combining FVGs, Liquidity, Order Blocks, and Market Structure in one tool.
Wskaźnik
RSI
RSI on the main chart with 45/55 momentum levels, overbought/oversold levels, averaged RSI, and multi-timeframe support.
Wskaźnik
ATR
SMC
+19
Smart Liquidity Sweep detector with auto-drawing True Channels and real market structure mapping.
Wskaźnik
Forex
BTCUSD
+5
Daily/Weekly/Monthly - Highs & Lows Indicator (Customizable Settings)
Wskaźnik
BOS
MSS
+4
See confirmed BOS, CHOCH and SWEEP structure events on your cTrader chart.

Cena

Od 24/03/2026
13
Sprzedaż
115
Bezpłatne instalacje



















