Opis
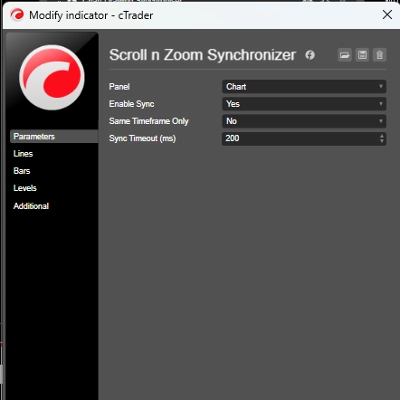
HTF Bias Detector — Edycja Panelu
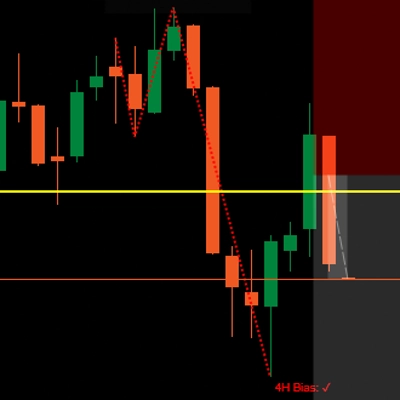
Zobacz historię wyższego interwału czasowego na pierwszy rzut oka. HTF Bias Detector wyświetla ostatnie N świec wyższego interwału czasowego w pływającym panelu bezpośrednio na Twoim wykresie — nie musisz zmieniać interwałów — i automatycznie identyfikuje dominujący bias, używając czterech instytucjonalnych wzorców price action.
Jak to działa
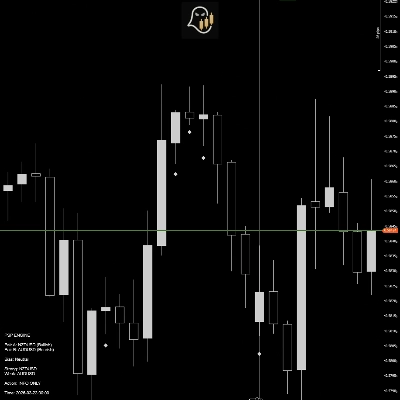
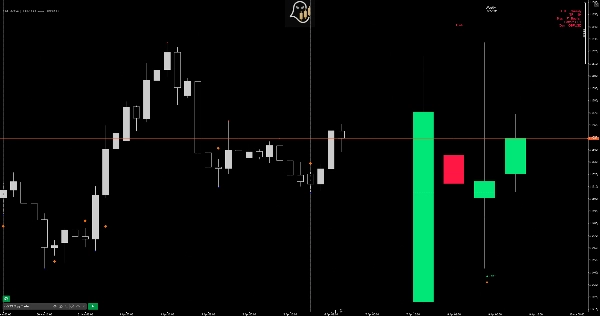
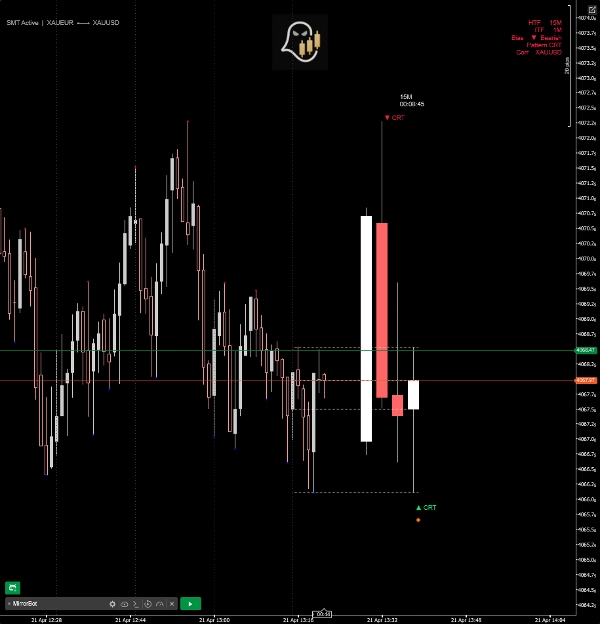
Indykator mapuje aktualny interwał czasowy wykresu na jego naturalny wyższy interwał (np. 5M → 1H, 1H → Daily) i rysuje te świece HTF w czystym panelu zakotwiczonym po prawej stronie ceny. Detekcja wzorców działa następnie na tych świecach w czasie rzeczywistym.
Wykryte wzorce
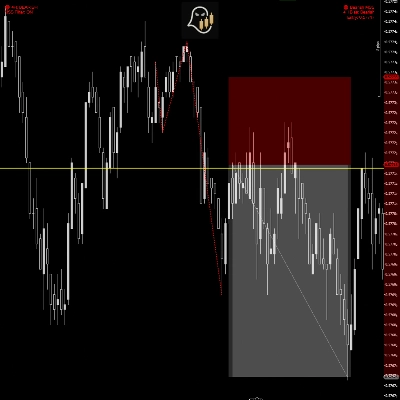
- CRT (Candle Range Theory) — identyfikuje świece pułapki, które przeczesują poprzedni szczyt lub dołek i zamykają się z powrotem wewnątrz, sygnalizując prawdopodobne odwrócenie.
- Ekspansja — oznacza świece, które całkowicie obejmują poprzedni zakres i zamykają się poza nim, potwierdzając kierunkowy impet.
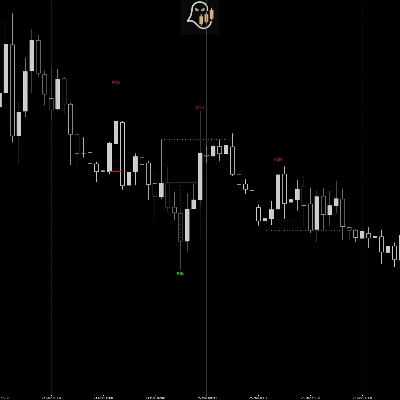
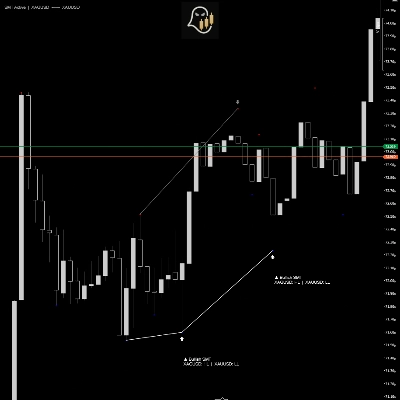
- Punkt Swing — wykrywa sekwencje trzech świec, gdzie świeca przesunięcia jest następnie podążana przez silne odwrócenie, oznaczając strukturalny punkt zwrotny.
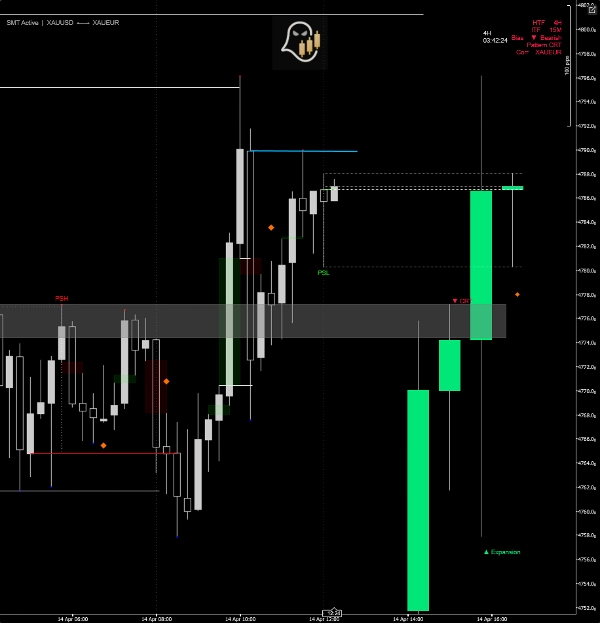
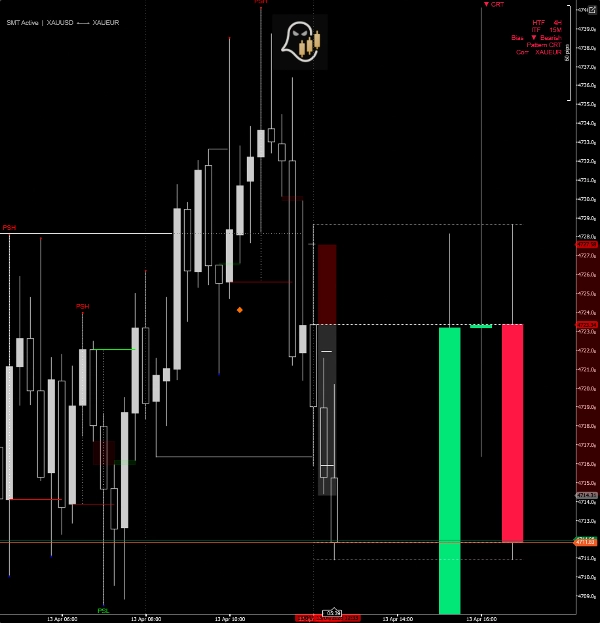
- PSP (Precision Swing Point) — sygnał dywergencji między parami. Gdy główny symbol i jego skorelowana para drukują przeciwstawne kierunkowe świece na tym samym słupku HTF, rysowany jest diament PSP.
Dywergencja SMT (Panel HTF)
Porównuje kolejne pary świec HTF między skorelowanymi instrumentami. Gdy jedna para tworzy niższy dołek, podczas gdy druga tworzy wyższy dołek (lub odwrotnie w przypadku szczytów), na panelu rysowana jest linia dywergencji SMT z etykietą kierunkową.
Automatyczne wykrywanie par skorelowanych
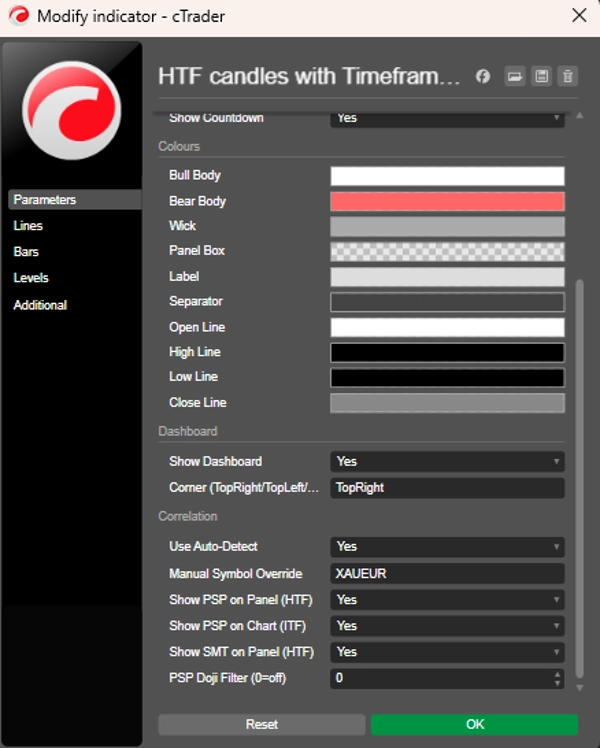
Automatycznie rozpoznaje skorelowany instrument dla symbolu Twojego wykresu — obejmując główne pary forex, metale, indeksy i kryptowaluty. Dostępna jest również ręczna nadpiska dla niestandardowych par lub symboli specyficznych dla brokera.
Dodatkowe funkcje
- Na żywo odliczanie do zamknięcia następnej świecy HTF
- Przerywane linie odniesienia OHLC dla aktualnie formującej się świecy HTF
- Pionowe separatory na wykresie na żywo wyrównane do czasów otwarcia HTF
- Kompaktowy panel pokazujący HTF, ITF, wykryty bias, nazwę wzorca i skorelowaną parę
- Diamenty PSP ITF rysowane bezpośrednio na słupkach wykresu (aktualny interwał)
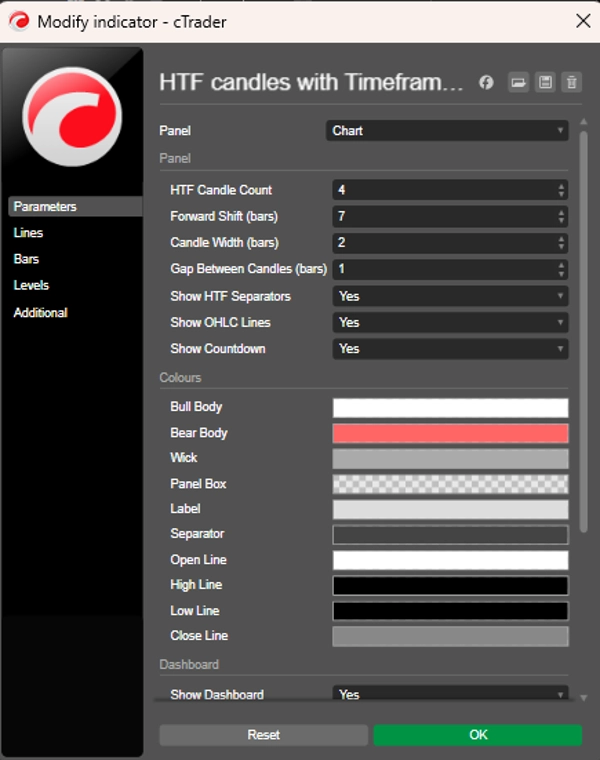
- W pełni konfigurowalne kolory, szerokość panelu, liczba świec i pozycjonowanie
- Filtr Doji do tłumienia słabych sygnałów PSP
Mapa interwałów czasowych
Wykres TF Panel HTF
1M – 4M 15M
5M – 10M 1H
15M – 30M 4H
1H Daily
4H Weekly
Daily Monthly
Podsumowanie
The indicator detects four institutional price action patterns in real time on these HTF candles: Candle Range Theory (CRT) trap candles signaling reversals, Expansion candles confirming momentum, Swing Point sequences marking structural turns, and Precision Swing Point (PSP) diamonds indicating cross-pair divergences. It also identifies SMT (Smart Money Technique) divergences between correlated instruments by comparing consecutive HTF candle pairs.
Correlated pairs are auto-detected for major forex pairs, metals, indices, and cryptocurrencies, with manual override options available. Additional features include a live countdown timer to the next HTF candle close, OHLC reference lines, vertical HTF open time separators, a compact dashboard showing HTF and intermediate timeframe bias and patterns, and customizable visual settings. The indicator supports multiple markets including forex, indices, and commodities.
Opinie klientów
5 | 50 % | |
4 | 50 % | |
3 | 0 % | |
2 | 0 % | |
1 | 0 % |