Açıklama
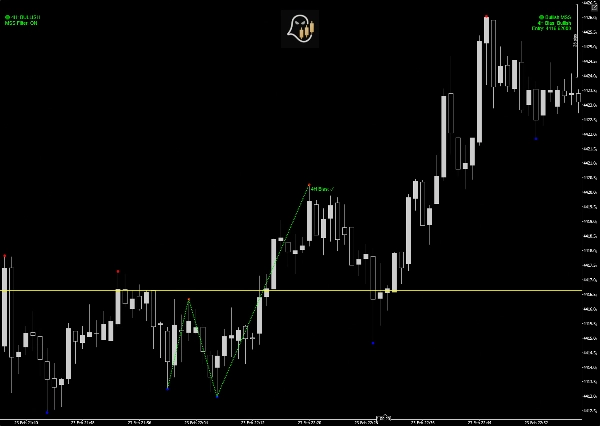
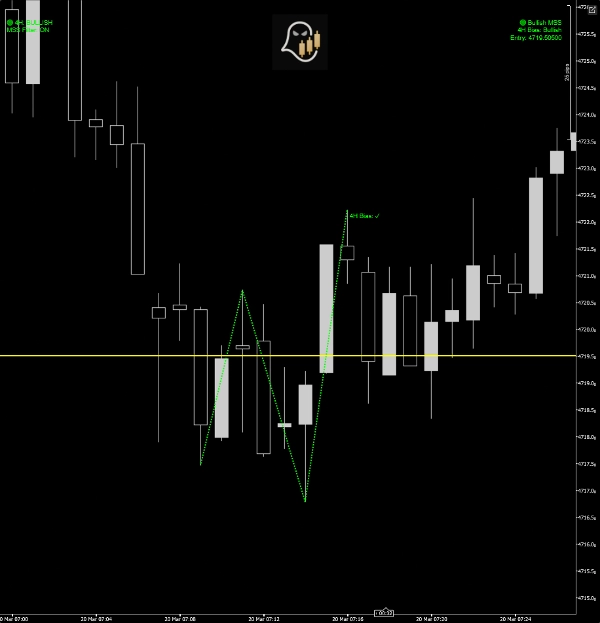
Gösterge, MSS (Piyasa Yapısı Değişimi) desenlerini, fraktal yüksekler ve düşüklerden oluşturulan.
Geçerli bir MSS için gereklidir:
- Bir dizi 4 fraktal salınım noktası
- Önceki salınım yapısının kırılması
- Karşı yönde onay
- İsteğe bağlı 4H eğilimi onayı
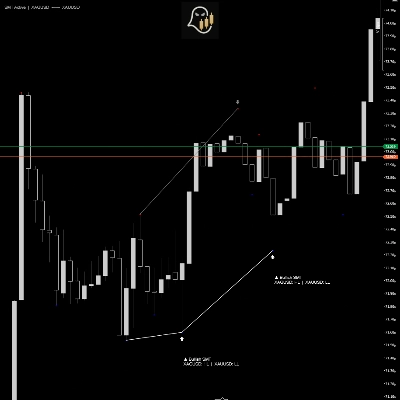
Tespit edildiğinde, gösterge sağlar:
- Görsel desen çizgileri
- Fibonacci giriş seviyesi (%50)
- Grafikte uyarı paneli
- İsteğe bağlı sesli uyarı
- Eğilim yönü gösterimi
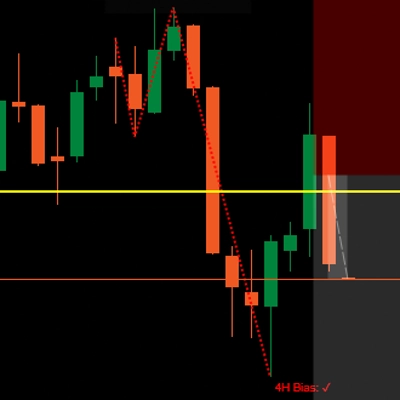
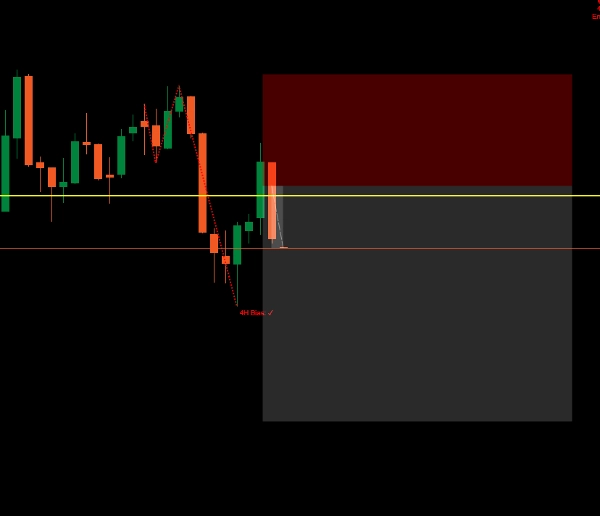
4 SAATLİK EĞİLİM FİLTRESİ
Etkinleştirildiğinde, gösterge sinyalleri önceki 4H mumunu kullanarak filtreler.
- Boğa 4H mumu → sadece boğa MSS gösterilir
- Ayı 4H mumu → sadece ayı MSS gösterilir
Bu, daha yüksek zaman dilimindeki momentuma karşı işlem yapmayı önler.
Eğilim, her birkaç dakikada otomatik olarak güncellenir ve grafikte gösterilir.
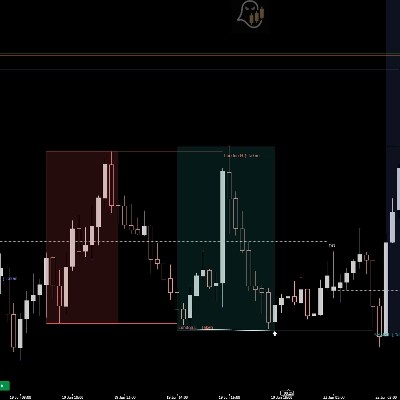
FİBONACCİ GİRİŞ SEVİYESİ
MSS tespit edildikten sonra, gösterge hesaplar:
Son iki salınım noktası arasındaki %50 geri çekilme
Bu seviye şunları temsil eder:
- Kurumsal yeniden giriş bölgesi
- Optimal geri çekilme alanı
- Risk açısından verimli giriş fiyatı
Seviye yatay bir çizgi olarak çizilir.
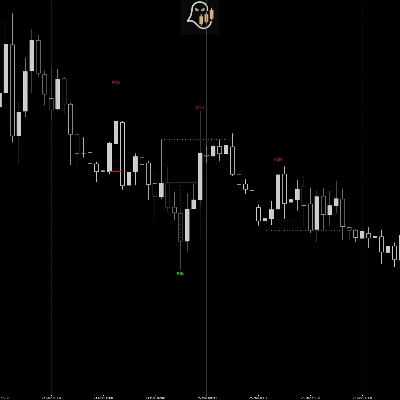
GÖRSEL ÇIKTILAR
Bir desen oluştuğunda, gösterge şunları gösterir:
✔ Desen çizgileri
Salınım noktalarını görsel olarak bağlar
✔ Fibonacci %50 seviyesi
Grafikte giriş bölgesi vurgulanır
✔ Eğilim gösterim paneli
Mevcut 4H yön eğilimini gösterir
✔ MSS uyarı paneli
Aktif sinyal ve giriş seviyesini gösterir
✔ Sesli uyarı (isteğe bağlı)
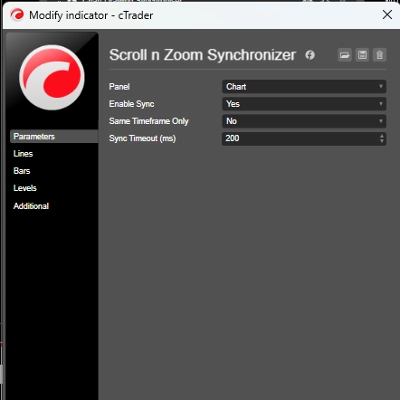
GİRDİ PARAMETRELERİ
Fraktal Periyot
Salınım hassasiyetini kontrol eder.
- Daha düşük değer → daha fazla sinyal
- Daha yüksek değer → sadece daha güçlü salınımlar
4H Eğilim Filtresi Kullan
Sinyalleri daha yüksek zaman dilimine göre filtreler.
Önerilen: AÇIK
MSS Uyarılarını Göster
Grafikte sinyal metnini gösterir.
Uyarı Sesi
MSS oluştuğunda bildirim çalar.
Desen Çizgilerini Çiz
Grafikte görsel yapıyı gösterir.
Sadece uyarılar istiyorsanız devre dışı bırakın.
GÖSTERGEYLE NASIL İŞLEM YAPILIR
Adım 1
MSS tespitini bekleyin.
Adım 2
Eğilim uyumunu onaylayın.
Adım 3
%50 Fibonacci seviyesini işaretleyin.
Adım 4
Fiyatın bölgeye geri çekilmesini bekleyin.
Adım 5
MSS yönünde giriş yapın.
Özet
Müşteri değerlendirmeleri
5 | 50 % | |
4 | 50 % | |
3 | 0 % | |
2 | 0 % | |
1 | 0 % |