

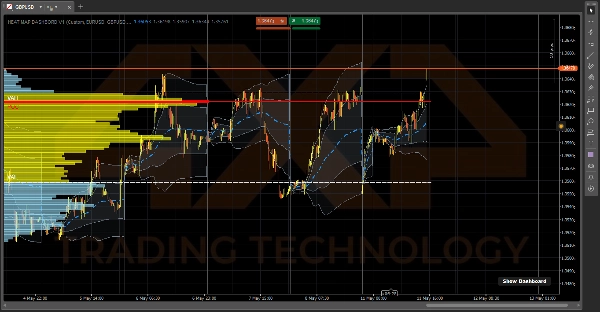

Açıklama
⚠️Güncelleme çıktı, gerçek derinlik bilgisi keyfini çıkarın⚠️
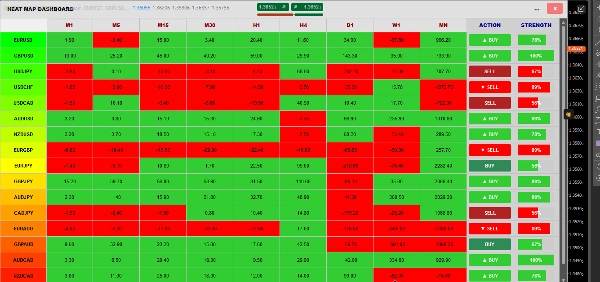
🔥 ISI HARİTASI PANOSU 📈
cTrader için Kurumsal Sınıf Sipariş Akışı ve Momentum Terminali.
Isı Haritası Panosu sadece temel bir grafik üstü katman değil—doğrudan platformunuza entegre edilmiş üç parçalı bir ticaret ekosistemidir. Bilgisayarınızı yavaşlatmadan piyasa likiditesine, gerçek hacim ağırlıklı ortalamalara ve makro düzeyde trendlere "X-Ray" görüşü sağlar. ⚡
🎯 Ne Yapar (Tüccarın Görüşü)
Sistem ticaretinizi üç basit adıma ayırır:
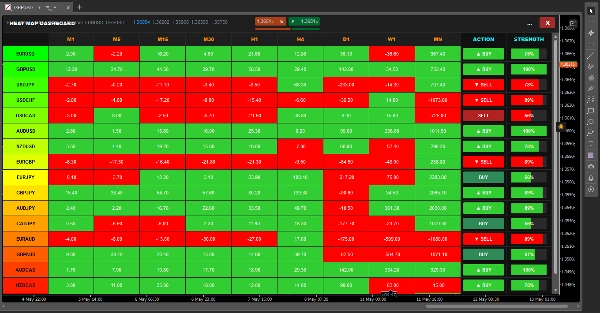
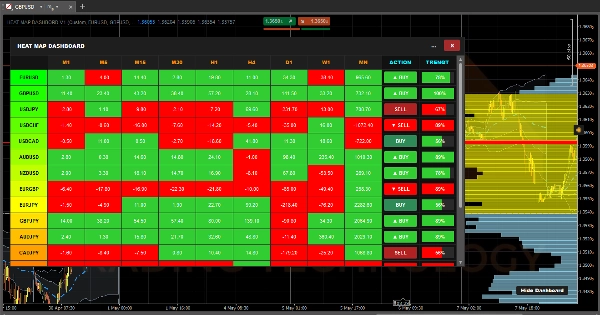
- 🎛️ Adım 1: NE ticaret yapılacak (Matris). Düzinece yakın grafik arasında tıklamak yerine, pano 9 zaman diliminde (M1'den Aylığa) 17 farklı varlığı tarar. Her hücre için momentumu hesaplar ve renk kodu uygular. Tek bir bakışta, hangi çiftin büyük bir trend içinde olduğunu ve ticarete hazır olduğunu tam olarak bilirsiniz.
- 🌊 Adım 2: KİM kontrol ediyor (VWAP). Bir çift seçtikten sonra, Günlük Sabitlenmiş VWAP'a bakın. Size sadece mum çubuklarına değil, hacme dayalı gerçek ortalama fiyatı gösterir. Gölgelendirilmiş Standart Sapma bulutları, dinamik destek/direnç olarak hareket eder ve piyasanın ne zaman aşırı alım veya aşırı satımda olduğunu tam olarak gösterir.
- 📊 Adım 3: NEREDE giriş yapılacak (VRVP). Son olarak, Görünür Aralık Hacim Profili ağır kurumsal likiditenin tam olarak nerede olduğunu haritalar. Otomatik olarak Kontrol Noktanızı (POC) ve %70 Değer Alanı (VAH & VAL) çizgilerini çizer, giriş ve çıkışlarınızı gerçekleştirmek için size nokta atışı doğru seviyeler sunar.
⚙️ Nasıl Çalışır (Kameranın Arkasında)
Bu kadar çok matematik yapmaya çalışan çoğu gösterge, platformunuzu anında dondurur ve cTrader'ı %100 CPU kullanımına kadar çökertebilir. Bunu önlemek için, Isı Haritası Panosu üç yüksek optimize edilmiş, bağımsız motor tarafından eşzamanlı olarak çalıştırılır:
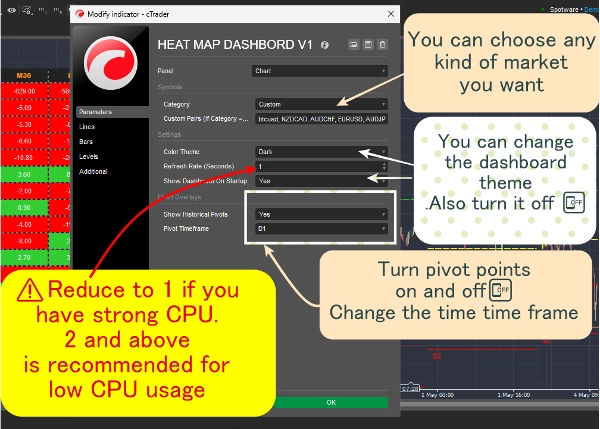
1. Pano Motoru (2 Saniyelik Nabız) ⏱️ Eğer her fiyat hareketinde 153 kombinasyonu (17 çift x 9 zaman dilimi) hesaplarsak, bilgisayarınız erir. Bunun yerine, bu motor katı bir 2 saniyelik nabız zamanlayıcısı ile çalışır. Her 2 saniyede bir, 14 mum öncesinin fiyatına sessizce bakar, mevcut fiyatla karşılaştırır ve hücreyi Yeşil (pozitif momentum) veya Kırmızı (negatif momentum) olarak boyar.
2. VRVP Motoru (Ekran Okuyucu) 🖥️ Binlerce geçmiş bar yüklemek yerine, Hacim Profili dinamik bir "Görünüm Dinleyicisi" olarak hareket eder. Sadece grafik üzerinde fiziksel olarak yakınlaştırma veya kaydırma yaptığınızda çalışır. cTrader'a ekranınızda şu anda hangi mumların göründüğünü sorar, bu belirli barlar için tam hacim örtüşmesini hesaplar ve %70 Değer Alanını anında yeniden çizer.
3. VWAP Motoru (Tick Toplayıcı) 🧮 VWAP canlı tick üzerinde hesaplanan tek şeydir. Ancak, onu son derece hızlı tutmak için hafif bir "Kümülatif Veri Serisi" kullanır. Tüm günü her saniye yeniden hesaplamak yerine, yeni tick hacmini arka planda çalışan toplamına ekler ve saat gece yarısını vurduğunda kendini otomatik olarak temizler.
4. Pencere Yöneticisi (Şekil Değiştirici) 🪟 Pano, monitörünüzü aktif olarak dinleyen özel bir C# boyutlandırma mantığı ile sarılmıştır. Maksimize Et [ ] veya Geri Yükle [=] düğmelerine bastığınızda, gösterge gerçek zamanlı olarak Chart.Width ve Chart.Height değerlerini okur ve ekranınıza mükemmel uyacak şekilde anında şekil değiştirir, çökmeye izin vermez!
Özet
1. Market Momentum Matrix: Scans 17 assets across 9 timeframes (from 1 minute to monthly), calculating and color-coding momentum to identify trending pairs quickly.
2. Daily Anchored Volume Weighted Average Price (VWAP): Displays true average prices weighted by volume, with dynamic standard deviation clouds indicating overbought or oversold conditions.
3. Visible Range Volume Profile (VRVP): Maps institutional liquidity by highlighting the Point of Control (POC) and 70% Value Area (VAH & VAL) within the visible chart range, aiding precise entry and exit levels.
The dashboard operates via four optimized engines: a 2-second heartbeat engine for momentum updates, a viewport-driven VRVP engine for volume profile recalculations, a tick-accumulating VWAP engine for real-time volume-weighted pricing, and a dynamic window manager that adjusts the interface to fit the chart size. This architecture ensures efficient performance and real-time responsiveness. The indicator supports visualization, signals (including trend strength, breakouts, and reversals), and filtering based on tick data, volume, and market structure analysis. It is tagged for aggressive trading, market structure, liquidity sweeps, support/resistance, and risk dashboard functionalities.
Müşteri değerlendirmeleri
5 | 67 % | |
4 | 33 % | |
3 | 0 % | |
2 | 0 % | |
1 | 0 % |
Tartışma
SSS
Bu oluşturanın diğer ürünleri


























Fiyat