

PnL Calendar Plus
Wtyczka desktopowa
Wersja 1.0, Sep 2026
Windows, Mac

Od 27/02/2026
33.16K
Wolumen transakcji
25.96K
Zysk w pipsach
10
Sprzedaż
500
Bezpłatne instalacje
Opis
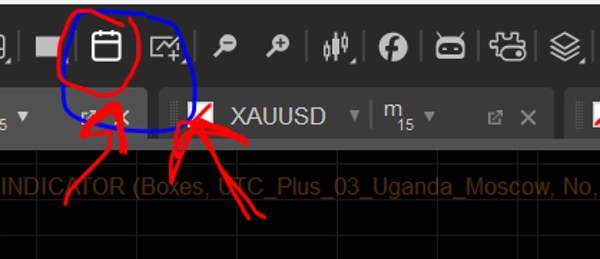
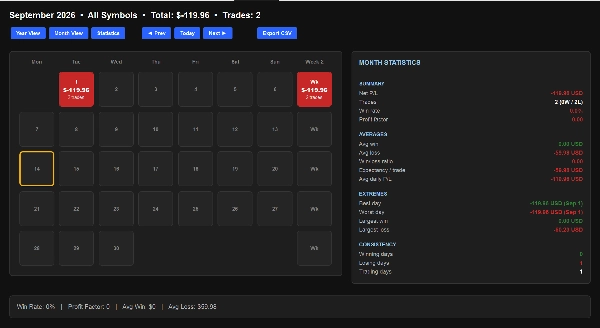
📅 Widok kalendarza PnL
- Miesięczne i roczne mapy cieplne: Zobacz dzienne i miesięczne zyski lub straty z kolorowymi kafelkami zysku (zielone) i straty (czerwone).
- Podsumowania tygodniowe: Śledzi całkowity PnL i liczbę transakcji na koniec każdego wiersza.
📊 Kompleksowy panel statystyk
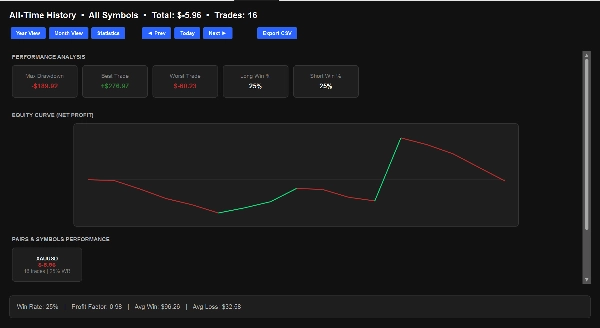
- Metryki wydajności: Zobacz swój całkowity współczynnik zysku, ogólny wskaźnik wygranych, średnie kwoty wygranych/strat oraz maksymalne obsunięcie kapitału.
- Wykres krzywej kapitału: Wizualny wykres śledzący postęp całkowitego zysku netto w czasie.
- Podział według symboli: Zobacz wydajność, wskaźniki wygranych i łączną liczbę transakcji podzieloną według konkretnych par walutowych lub instrumentów.
- Analiza czasu: Automatycznie identyfikuje Twoje najbardziej dochodowe dni handlowe i najlepsze miesiące.
🔒 Bezpieczne i lekkie
- Brak specjalnych uprawnień: Działa z standardowymi prawami dostępu (
AccessRights.None), co czyni go całkowicie bezpiecznym i łatwym do przesłania do cTrader.
Podsumowanie
Podsumowanie AI
PnL Calendar Plus is a cTrader plugin designed to visualize and analyze trading performance through a calendar-based interface and detailed statistics. It features monthly and yearly heatmaps that display daily and monthly profits or losses using color-coded tiles (green for profit, red for loss). Weekly summaries provide total profit and loss (PnL) and trade counts for each week.
The plugin includes a comprehensive statistics dashboard offering key performance metrics such as total profit factor, overall win rate, average win and loss amounts, and maximum drawdown. An equity curve chart tracks net profit progression over time. Users can view a symbol breakdown showing performance, win rates, and trade counts by specific currency pairs or instruments. Time analysis automatically identifies the most profitable trading days and months.
PnL Calendar Plus operates with standard access rights, requiring no special permissions, ensuring safe and lightweight integration within the cTrader platform. It supports historical data analysis and is categorized under trade journaling and chart UI tools.
The plugin includes a comprehensive statistics dashboard offering key performance metrics such as total profit factor, overall win rate, average win and loss amounts, and maximum drawdown. An equity curve chart tracks net profit progression over time. Users can view a symbol breakdown showing performance, win rates, and trade counts by specific currency pairs or instruments. Time analysis automatically identifies the most profitable trading days and months.
PnL Calendar Plus operates with standard access rights, requiring no special permissions, ensuring safe and lightweight integration within the cTrader platform. It supports historical data analysis and is categorized under trade journaling and chart UI tools.
Profil wtyczki
Kategoria wtyczki
Dziennik
Dostęp do danych
Historia
Opinie klientów
0.0
Opinie: 0
Opinie klientów
Ten produkt nie ma jeszcze opinii. Wypróbowałeś(-aś) go już? Bądź pierwszy(-a) i powiedz o tym innym!
Dyskusja
Częste pytania
AI Integration
Chart UI Tools
Trade Journal
Produkty dostępne za pośrednictwem cTrader Store, w tym boty handlowe, wskaźniki i wtyczki, dostarczane są przez deweloperów zewnętrznych i udostępniane wyłącznie w celach informacyjnych oraz w celu zapewnienia dostępu technicznego. cTrader Store nie jest brokerem i nie zapewnia doradztwa inwestycyjnego, nie udziela spersonalizowanych rekomendacji ani nie gwarantuje przyszłych wyników.









Cena
Od 27/02/2026
33.16K
Wolumen transakcji
25.96K
Zysk w pipsach
10
Sprzedaż
500
Bezpłatne instalacje