
Opis
| ALL IN ONE TRADING PRO|
## Co to jest ten wskaźnik?
Ten wskaźnik umieszcza na twoim wykresie **trzy pomocne narzędzia handlowe** jednocześnie. Pomyśl o tym jak o trzech ekspertach traderach, którzy jednocześnie dzielą się swoją opinią
=====================================================
## Te trzy narzędzia
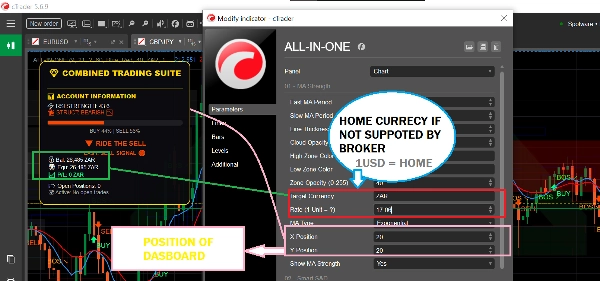
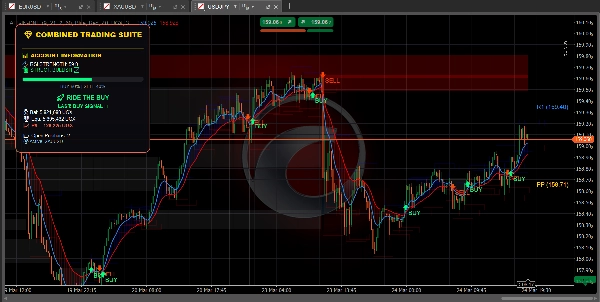
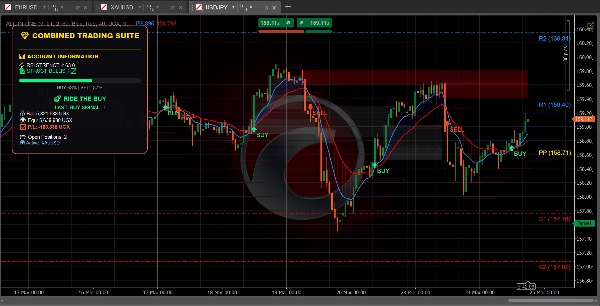
### 1. PANEL TRENDU (Śledzenie trendu)
**Co robi:** Informuje, w którym kierunku porusza się rynek i jak silny jest ruch.
**Co widzisz:**
- **Niebieska linia** = Szybka średnia krocząca (trend krótkoterminowy)
- **Czerwona linia** = Wolna średnia krocząca (trend długoterminowy)
- **Niebieska chmura** = Trend wzrostowy (cena rośnie)
- **Czerwona chmura** = Trend spadkowy (cena spada)
- **Zielona strzałka** = Pojawia się sygnał KUPNA
- **Czerwona strzałka** = Pojawia się sygnał SPRZEDAŻY
- **Słupki RSI** = Pokazują, czy rynek jest wykupiony (za wysoki) lub wyprzedany (za niski)
========================================================
**Pokazuje także:**
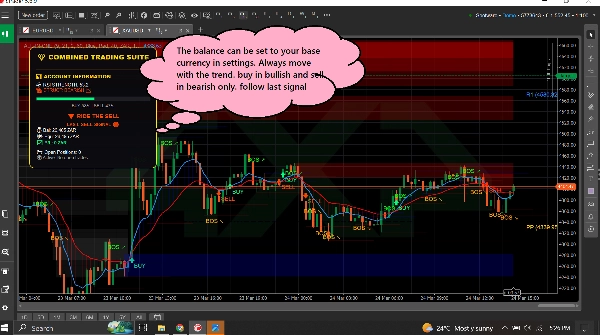
- Saldo twojego konta oraz zysk/stratę
- Ile pozycji masz otwartych
- Proste tekstowe porady jak "BEZPIECZNE DO KUPNA" lub "JEDŹ NA KUPNO"
============================================================
### 2. STREFY POPYTU I PODAŻY (Znajdź kluczowe poziomy)
**Co robi:** Znajduje ważne poziomy cenowe, gdzie rynek może się odwrócić lub zatrzymać.
**Co widzisz:**
- **Niebieskie pola** = Strefy popytu (obszary, gdzie kupujący wchodzą - DOBRE do kupna)
- **Czerwone pola** = Strefy podaży (obszary, gdzie sprzedający wchodzą - DOBRE do sprzedaży)
- **Szare pola** = Strefy, które były testowane (mniej wiarygodne)
============================================================
**Jak używać:**
- Cena idzie W DÓŁ w kierunku niebieskiego pola? Szukaj KUPNA
- Cena idzie W GÓRĘ w kierunku czerwonego pola? Szukaj SPRZEDAŻY
- Świeże (jasne) pola działają lepiej niż szare
============================================================
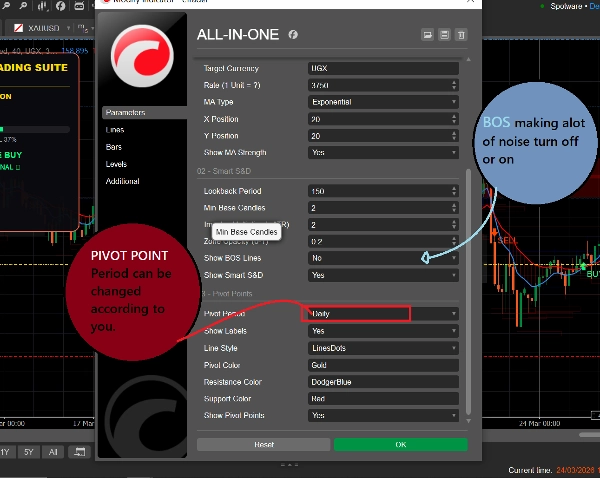
**Pokazuje także:**
- **BOS ↗** = Rynek przebił się wyżej, trend może się utrzymać wzrostowy
- **BOS ↘** = Rynek przebił się niżej, trend może się utrzymać spadkowy
============================================================
### 3. PUNKTY PIVOT (Poziomy wsparcia i oporu)
**Co robi:** Oblicza automatyczne poziomy cen, gdzie rynek często się zatrzymuje lub odwraca.
**Co widzisz:**
- **Złota linia** = Punkt pivot (poziom centralny)
- **Niebieskie linie** = Poziomy oporu (cena może tu spaść)
- **Czerwone linie** = Poziomy wsparcia (cena może tu wzrosnąć)
============================================================
**Możesz wybrać:**
- **Dzienny** = Poziomy zmieniają się raz dziennie
- **Tygodniowy** = Poziomy zmieniają się raz w tygodniu
- **Miesięczny** = Poziomy zmieniają się raz w miesiącu
- **15-minutowy** = Poziomy zmieniają się co 15 minut (dobry do szybkiego handlu)
============================================================
## Jak go używać (prosto)
### Aby znaleźć transakcję KUPNA:
1. Poczekaj, aż cena dotrze do **niebieskiego pola popytu**
2. Sprawdź, czy niebieska linia MA jest powyżej czerwonej linii MA (trend wzrostowy)
3. Sygnały powinny być brane pod uwagę tylko, gdy rynek jest w odpowiednim trendzie
============================================================
### Aby znaleźć transakcję SPRZEDAŻY:
1. Poczekaj, aż cena dotrze do **czerwonego pola podaży**
2. Sprawdź, czy czerwona linia MA jest powyżej niebieskiej linii MA (trend spadkowy)
3. Sygnały powinny być brane pod uwagę tylko, gdy rynek jest w odpowiednim trendzie
============================================================
### Aby znaleźć szybkie transakcje:
1. Używaj 15-minutowych punktów pivot dla precyzyjnych poziomów
2. Obserwuj strzałki BOS dla kierunku trendu
3. Sprawdzaj panel, aby ocenić siłę rynku
4. Podejmuj transakcje zgodne z kierunkiem
============================================================
## Co oznaczają wszystkie kolory
| Kolor | Co oznacza |
| 🟦 Niebieski | Byczy / sygnały kupna / strefy popytu / pivoty oporu |
| 🔴 Czerwony | Niedźwiedzi / sygnały sprzedaży / strefy podaży / pivoty wsparcia |
| 🟨 Złoty | Punkt pivot (poziom centralny) |
| ⚪ Szary | Testowane strefy (już odwiedzone) |
| 🟢 Zielona strzałka | Sygnał KUPNA |
| 🔴 Czerwona strzałka | Sygnał SPRZEDAŻY |
============================================================
## Proste ustawienia dla początkujących
============================================================
### Do szybkiego handlu (skalpowanie):
- Okres pivot: **15 minut**
- Szybka MA: **5**
- Wolna MA: **13**
- Włącz: Wszystkie trzy narzędzia
============================================================
### Do handlu dziennego:
- Okres pivot: **Dzienny**
- Szybka MA: **9**
- Wolna MA: **21**
- Włącz: Wszystkie trzy narzędzia
============================================================
### Do handlu długoterminowego:
- Okres pivot: **Tygodniowy**
- Szybka MA: **21**
- Wolna MA: **55**
- Włącz: Panel trendu + punkty pivot
=========================================================
## Jedna zasada do zapamiętania
=========================================================
**Nie handluj, gdy narzędzia się nie zgadzają!**
Jeśli panel mówi KUP, ale cena jest w czerwonej strefie podaży - poczekaj na jasność.
Jeśli panel mówi SPRZEDAJ, ale cena jest w niebieskiej strefie popytu - poczekaj na jasność.
Najlepsze transakcje zdarzają się, gdy WSZYSTKIE narzędzia wskazują ten sam kierunek.
============================================================
## Szybki start
1. Dodaj wskaźnik do swojego wykresu
2. Na początek pozostaw wszystkie ustawienia domyślne
3. Obserwuj, jak cena zachowuje się przy kolorowych polach i liniach
4. Po kilku dniach dostosuj ustawienia do swojego stylu
5. Używaj panelu do monitorowania konta w czasie rzeczywistym
============================================================
To wszystko! Trzy narzędzia, jeden wskaźnik, prosty handel.
Podsumowanie
1. Trend Dashboard: Displays short-term (blue line) and long-term (red line) moving averages, colored clouds indicating uptrend (blue) or downtrend (red), buy (green arrow) and sell (red arrow) signals, and an RSI bar showing overbought or oversold conditions. It also shows account balance, open positions, and simple text advice.
2. Supply & Demand Zones: Highlights important price levels with blue boxes for demand zones (buying areas), red boxes for supply zones (selling areas), and gray boxes for tested zones (less reliable). It includes breakout signals (BOS arrows) indicating potential trend continuation.
3. Pivot Points: Automatically calculates support and resistance levels with a gold pivot point line, blue resistance lines, and red support lines. Users can select pivot periods from 15-minute to monthly intervals for different trading styles.
The indicator supports multiple markets including Forex, Crypto, Stocks, and Indices, and provides visual signals such as crossovers, breakouts, and level touches. It is designed for various trading styles, from scalping to long-term trading, with recommended settings for each. The tool emphasizes trading only when all three components align in direction to improve trade clarity and consistency.
Opinie klientów
5 | 100 % | |
4 | 0 % | |
3 | 0 % | |
2 | 0 % | |
1 | 0 % |


![Logo „[Hamster-Coder] Bollinger Bands”](https://cdn.ctrader.com/image/webp/21d8e5d6-fb11-4bac-b9ee-cd05c2b76804_30327)


