Opis
The Linear Regression Oscillator (LRO) jest wskaźnikiem technicznym opartym na analizie regresji liniowej, powszechnie stosowanym na rynkach finansowych do oceny momentum i kierunku trendów cenowych. Mierzy odległość między aktualną ceną a wartością przewidywaną przez linię regresji liniowej, która jest zasadniczo linią najlepszego dopasowania w określonym okresie. Oto podział, jak działa i jakie ma składniki:
Kluczowe składniki Linear Regression Oscillator
- Linia regresji liniowej (linia najlepszego dopasowania): Ta linia reprezentuje oczekiwany ruch cen w określonym okresie i jest obliczana za pomocą technik regresji liniowej. Nachylenie linii wskazuje kierunek trendu: dodatnie nachylenie sugeruje trend wzrostowy, natomiast ujemne nachylenie wskazuje na trend spadkowy.
- Wartości oscylatora: Wartość oscylatora jest obliczana przez mierzenie odchylenia między aktualną ceną a linią regresji liniowej. To odchylenie jest wykreślane jako wartość oscylatora, zazwyczaj oscylująca wokół linii zerowej.
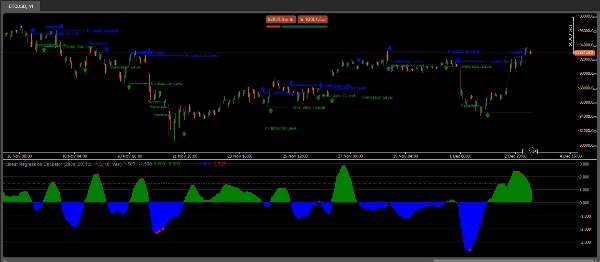
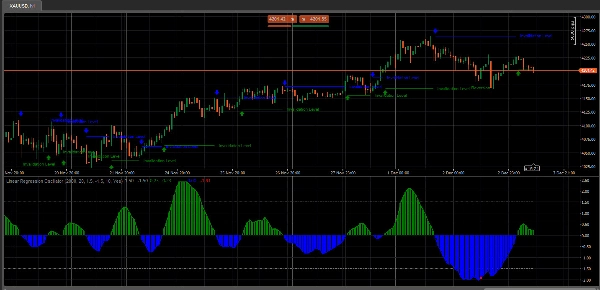
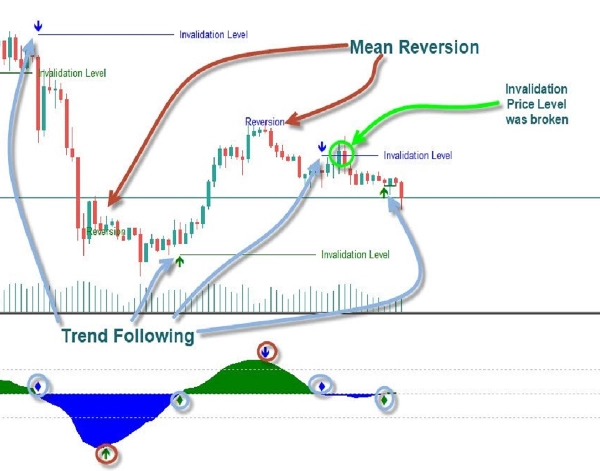
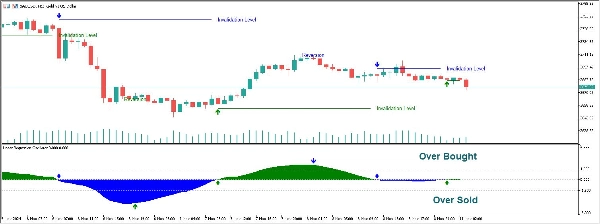
- Linia zerowa: Linia zerowa na wykresie LRO działa jako linia bazowa. Gdy wartość oscylatora przekracza linię zerową w górę, sugeruje to bycze momentum, a przekroczenie w dół wskazuje na niedźwiedzie momentum.
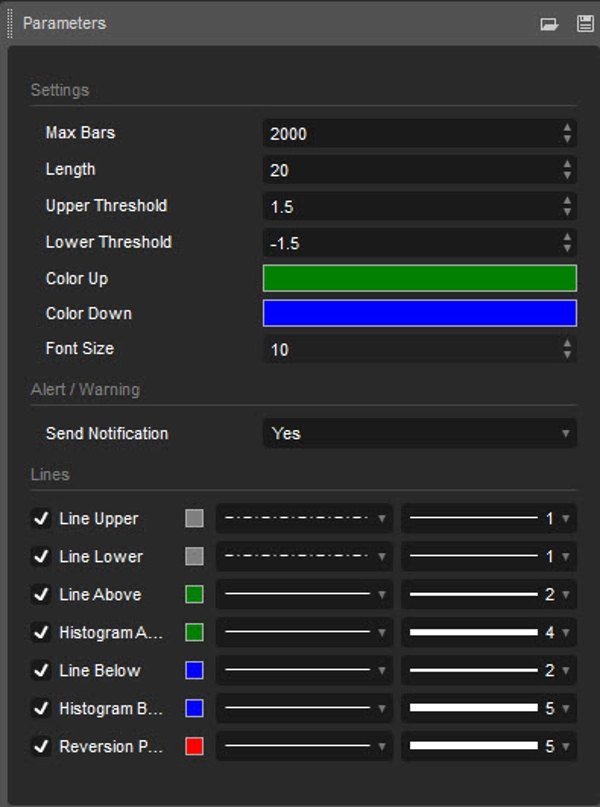
- Ustawienia i okresy: Ustawienie okresu definiuje liczbę słupków lub punktów danych branych pod uwagę przy obliczaniu linii regresji liniowej. Traderzy dostosowują to ustawienie do krótkoterminowych lub długoterminowych strategii handlowych, w zależności od preferowanego okresu analizy.
Jak traderzy używają Linear Regression Oscillator
- Identyfikacja trendów: LRO pomaga traderom zobaczyć, czy obecny trend cenowy ma momentum, pokazując względną odległość między ceną a jej oczekiwaną (regresyjną) linią.
- Poziomy wykupienia/przeciążenia: Ekstremalne wartości oscylatora mogą wskazywać na warunki wykupienia lub wyprzedania, sugerując potencjalną zmianę trendu lub potrzebę dostosowania pozycji.
- Sygnały dywergencji: Gdy ruchy cen i wskaźnik LRO się rozchodzą, może to sygnalizować osłabienie momentum lub możliwą zmianę trendu.
Wskazówki interpretacyjne
- Przekroczenie linii zerowej: Przekroczenie powyżej zera może wskazywać na pojawiający się trend wzrostowy, podczas gdy przekroczenie poniżej zera sugeruje trend spadkowy.
- Dostosowywanie okresów: Krótsze okresy sprawiają, że LRO jest bardziej czuły, wychwytując szybkie ruchy cen, ale zwiększając szumy. Dłuższe okresy wygładzają wahania, co jest odpowiednie do identyfikacji długoterminowych trendów.
Uwagi dotyczące użytkowania:
- Długość: Określa okres, na podstawie którego obliczana jest regresja liniowa
- Górny/dolny próg: Definiują górne i dolne granice do identyfikacji warunków wykupienia i wyprzedania. Wartości poza tymi progami sugerują potencjalne odwrócenia.
Linear Regression Oscillator jest ceniony za łączenie analizy statystycznej z zasadami podążania za trendem, co czyni go wszechstronnym narzędziem zarówno dla traderów momentum, jak i trendu. Jest szczególnie przydatny na rynkach trendowych, gdzie pomaga identyfikować kontynuacje trendu lub odwrócenia na podstawie odchyleń od linii trendu regresji.
Podsumowanie
Opinie klientów
5 | 0 % | |
4 | 100 % | |
3 | 0 % | |
2 | 0 % | |
1 | 0 % |