Opis
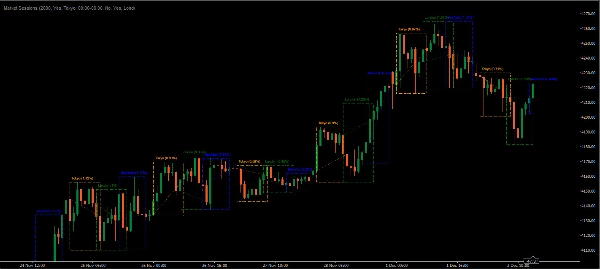
Wskaźnik Market Sessions jest popularnym narzędziem wśród traderów forex i akcji do wizualnego przedstawiania globalnych sesji handlowych na wykresie cenowym. Podkreśla on okresy czasowe głównych sesji handlowych — takich jak azjatycka (Tokio), europejska (Londyn) oraz amerykańska (Nowy Jork) bezpośrednio na wykresie. Pomaga to traderom zidentyfikować momenty otwarcia i zamknięcia rynków, umożliwiając lepsze podejmowanie decyzji w oparciu o zachowania handlowe specyficzne dla danej sesji.
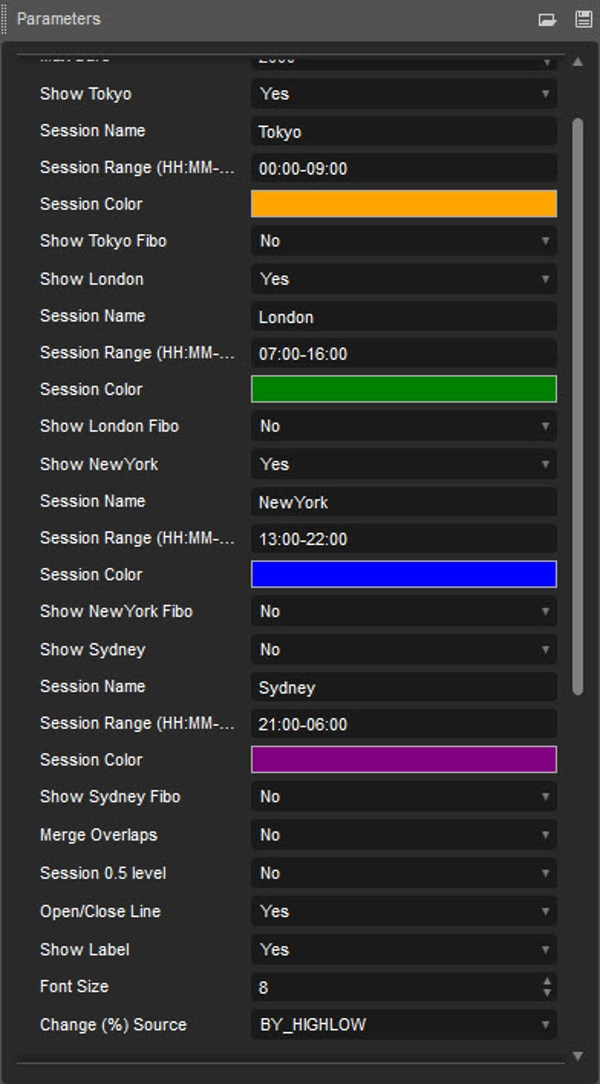
- Sesja azjatycka (domyślnie: 00:00-09:00)
- Sesja londyńska (domyślnie: 07:00-16:00)
- Sesja nowojorska (domyślnie: 13:00-22:00)
- Sesja w Sydney (domyślnie: 21:00-06:00)
Kluczowe cechy wskaźnika Market Sessions
- Czas trwania sesji i nakładanie się:
-
- Wskaźnik zaznacza godziny rozpoczęcia i zakończenia każdej sesji. Ta funkcja jest pomocna, ponieważ każda sesja ma unikalne cechy — na przykład sesja azjatycka jest zazwyczaj spokojniejsza, podczas gdy sesja londyńska często charakteryzuje się dużą zmiennością. Nakładki, takie jak nakładanie się sesji londyńskiej i nowojorskiej, są również zaznaczone, wskazując okresy zwiększonej aktywności.
- Możliwość dostosowania kolorów sesji:
-
- Traderzy często mogą dostosować kolory dla każdej sesji, co ułatwia ich wizualne rozróżnienie. Ta personalizacja zwiększa przejrzystość i pomaga skupić się na wybranych sesjach.
- Regulowane strefy czasowe:
-
- Ponieważ traderzy znajdują się na całym świecie, wskaźnik zazwyczaj pozwala na dostosowanie stref czasowych, dopasowując godziny rozpoczęcia i zakończenia sesji do lokalnego czasu tradera, co jest szczególnie przydatne dla osób znajdujących się w innych strefach czasowych niż główne centra handlowe.
- Strategie specyficzne dla sesji:
-
- Każda sesja ma swoje charakterystyczne cechy. Na przykład sesja londyńska jest często najbardziej zmienna, oferując możliwości wybicia, podczas gdy sesja azjatycka zazwyczaj jest spokojniejsza, co może sprzyjać strategiom handlu w zakresie. Zrozumienie tych niuansów pozwala traderom dostosować strategie do trendów sesji.
Dlaczego warto używać wskaźnika Market Sessions?
- Lepsze wyczucie czasu transakcji:
-
- Znając aktywną sesję, traderzy mogą dostosować swoje strategie, aby wykorzystać różne poziomy zmienności i płynności.
- Ulepszona analiza i rozwój strategii:
-
- Dzięki wizualnemu oznaczeniu godzin sesji traderzy mogą analizować zachowanie cen w różnych sesjach, aby opracować i udoskonalić strategie najlepiej dopasowane do cech każdej sesji.
- Zwiększona świadomość zmienności rynku:
-
- Zmienność często wzrasta podczas otwarć, zamknięć i nakładek sesji. Wskaźnik pomaga przewidywać te ruchy, zmniejszając ryzyko zaskoczenia nagłymi zmianami na rynku.
Przykładowe zastosowanie
Trader zainteresowany zmiennością może celować w okres nakładania się sesji londyńskiej i nowojorskiej, aby wykorzystać większy ruch na rynku. Korzystając ze wskaźnika Market Sessions, może planować transakcje tak, aby pokrywały się z tym nakładaniem, co potencjalnie zwiększa szanse na złapanie istotnego ruchu cenowego.
Podsumowując, wskaźnik Market Sessions jest niezbędny dla traderów, którzy chcą podejmować świadome decyzje oparte na zachowaniach rynku specyficznych dla określonych godzin. Zapewnia przejrzystość, wzmacnia analizę i może wspierać skuteczniejsze strategie handlowe.
Podsumowanie
Opinie klientów
5 | 33 % | |
4 | 67 % | |
3 | 0 % | |
2 | 0 % | |
1 | 0 % |