
E7 Volume Profile
Wskaźnik
1.16K pobrania
Wersja 1.0, Feb 2025
Windows, Mac
4.6
Opinie: 3
Opis
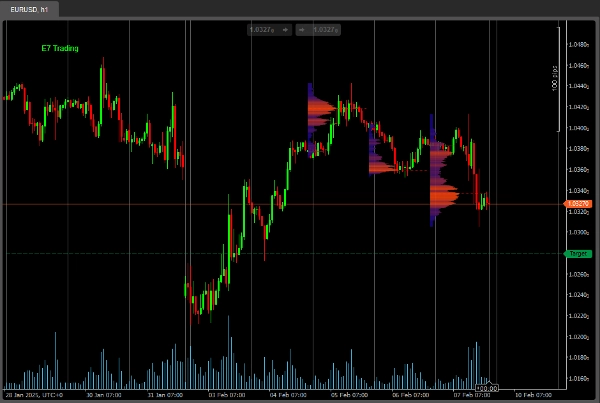
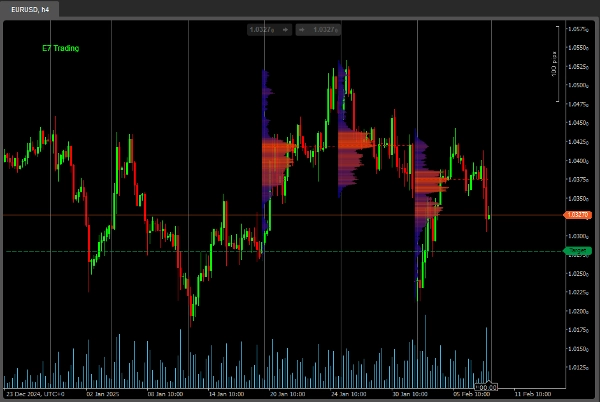
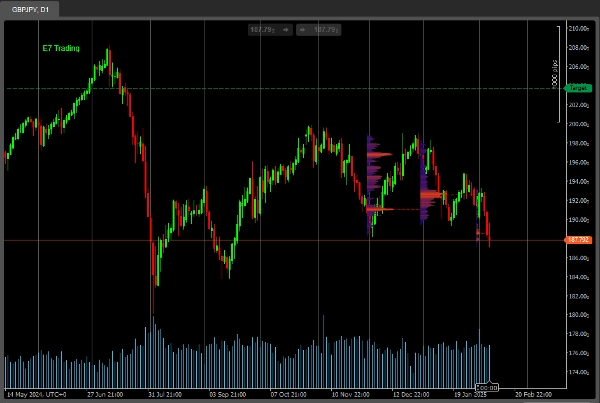
To jest prosty wskaźnik Volume Profile, dostosowany do bardziej nowoczesnego wyglądu i odczuć.
Ta podstawowa wersja jest ograniczona do tylko 3 'Okresów retrospektywnych'.
Pełna wersja pojawi się wkrótce, bądźcie czujni.
Szczęśliwego polowania!
Podsumowanie
Podsumowanie AI
E7 Volume Profile is a volume profile indicator designed with a modern visual style. It provides traders with volume distribution information over price levels, helping to identify key support and resistance areas. This basic version supports analysis over three distinct lookback periods, allowing users to observe volume patterns within limited historical ranges. The indicator is suitable for use on various timeframes, as illustrated by examples on 1-hour, 4-hour, and daily charts. A full version with expanded features is planned for future release.
Profil wskaźnika
Opinie klientów
4.6
Opinie: 3
5 | 67 % | |
4 | 33 % | |
3 | 0 % | |
2 | 0 % | |
1 | 0 % |
Opinie klientów
July 14, 2025
Pros: Clearly visualizes volume distribution with POC, VAH, VAL zones. Customizable and stable across timeframes. Cons: No tooltips or alerts. Lacks template saving and dynamic profile history. Requires confirmation tools for trading signals.
Dyskusja
Częste pytania
Produkty dostępne za pośrednictwem cTrader Store, w tym boty handlowe, wskaźniki i wtyczki, dostarczane są przez deweloperów zewnętrznych i udostępniane wyłącznie w celach informacyjnych oraz w celu zapewnienia dostępu technicznego. cTrader Store nie jest brokerem i nie zapewnia doradztwa inwestycyjnego, nie udziela spersonalizowanych rekomendacji ani nie gwarantuje przyszłych wyników.
Więcej od tego autora


Cena
Od 18/12/2024
2
Sprzedaż
4.27K
Bezpłatne instalacje