
E7 Polynomial Regression Channel
Wskaźnik
891 pobrania
Wersja 1.0, Feb 2025
Windows, Mac
4.8
Opinie: 5
Opis
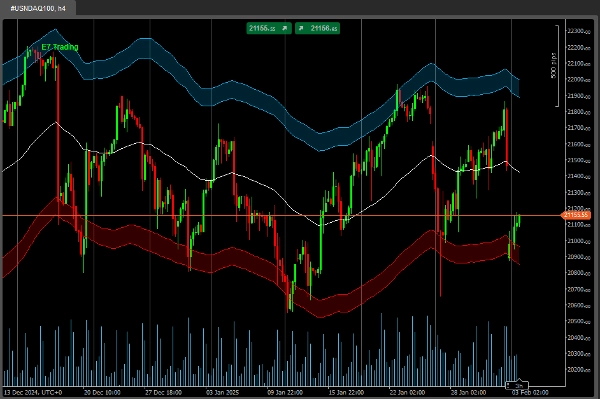
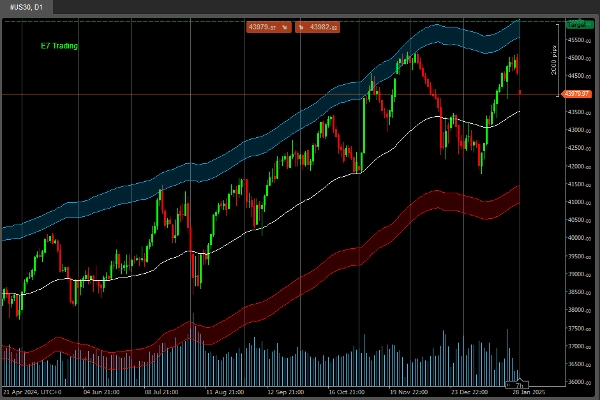
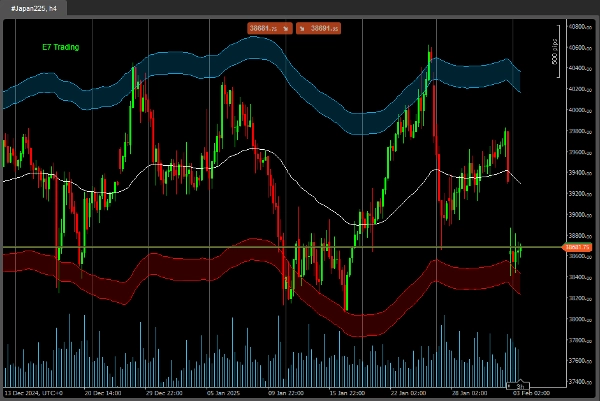
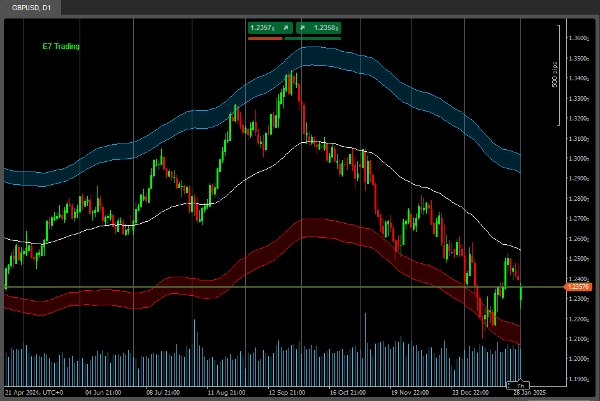
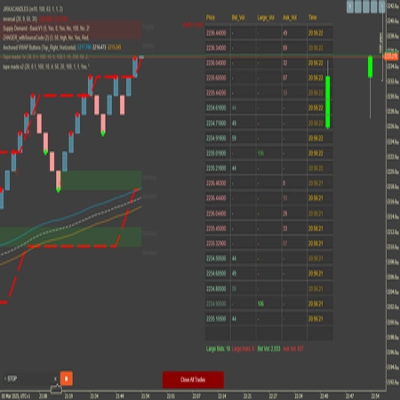
To jest dostosowany kanał regresji wielomianowej.
Odzwierciedla on również zmienność bazowego aktywa.
Pozwala to na lepszą analizę, jak nauczono w strategiach E7.
Szczęśliwego polowania!
Podsumowanie
Podsumowanie AI
The E7 Polynomial Regression Channel is a customized technical indicator designed for market analysis. It applies polynomial regression to price data, creating a channel that adapts to the underlying asset's price movements. This channel also incorporates volatility measures, allowing users to assess market conditions more comprehensively. By reflecting both trend and volatility, it supports enhanced analysis consistent with the methodologies taught in the E7 Strategies. The indicator is intended for use in trading platforms to assist traders in identifying potential price channels and volatility shifts.
Profil wskaźnika
Opinie klientów
4.8
Opinie: 5
5 | 80 % | |
4 | 20 % | |
3 | 0 % | |
2 | 0 % | |
1 | 0 % |
Opinie klientów
July 14, 2025
Pros: Polynomial regression with adjustable degree and deviation channels. Great for identifying trend zones and reversals. Works across timeframes. Cons: No alerts or tooltips. High polynomial degrees may cause lag. Lacks template saving for user settings.
May 1, 2025
This is very good Mate, i really like it, i am working o an Cbot with few indicators, could you share me this one code to include it?
Dyskusja
Częste pytania
Produkty dostępne za pośrednictwem cTrader Store, w tym boty handlowe, wskaźniki i wtyczki, dostarczane są przez deweloperów zewnętrznych i udostępniane wyłącznie w celach informacyjnych oraz w celu zapewnienia dostępu technicznego. cTrader Store nie jest brokerem i nie zapewnia doradztwa inwestycyjnego, nie udziela spersonalizowanych rekomendacji ani nie gwarantuje przyszłych wyników.
Więcej od tego autora


Cena
Od 18/12/2024
2
Sprzedaż
4.27K
Bezpłatne instalacje