
E7 cTrader User ID
Wskaźnik
68 pobrania
Wersja 1.0, Jan 2025
Windows, Mac
Opis
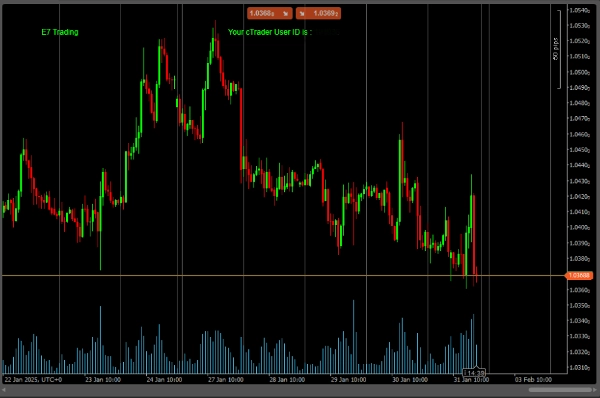
Prosty wskaźnik do uzyskania Twojego ID cTrader.
Twoje ID cTrader będzie znajdować się na górze wykresu w kolorze limonkowym.
Po prostu dodaj ten wskaźnik do wykresu lub dodaj instancję do tego wskaźnika.
Udanych łowów!
Podsumowanie
Profil wskaźnika
Opinie klientów
0.0
Opinie: 0
Opinie klientów
Ten produkt nie ma jeszcze opinii. Wypróbowałeś(-aś) go już? Bądź pierwszy(-a) i powiedz o tym innym!
Dyskusja
Częste pytania
Produkty dostępne za pośrednictwem cTrader Store, w tym boty handlowe, wskaźniki i wtyczki, dostarczane są przez deweloperów zewnętrznych i udostępniane wyłącznie w celach informacyjnych oraz w celu zapewnienia dostępu technicznego. cTrader Store nie jest brokerem i nie zapewnia doradztwa inwestycyjnego, nie udziela spersonalizowanych rekomendacji ani nie gwarantuje przyszłych wyników.
Więcej od tego autora


Cena
Od 18/12/2024
2
Sprzedaż
4.2K
Bezpłatne instalacje