Opis
Teoria Darvas Box
Teoria Darvas Box to technika handlowa opracowana przez Nicolasa Darvasa w latach 50. XX wieku. Jest to strategia handlowa oparta na momentum, która wykorzystuje ruchy cen do identyfikacji potencjalnych punktów wejścia i wyjścia na rynku.
Jak działa Darvas Box
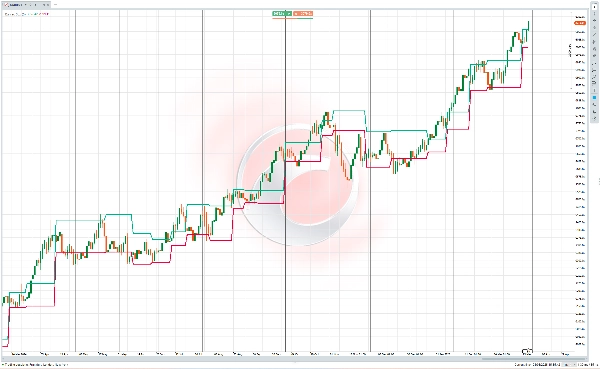
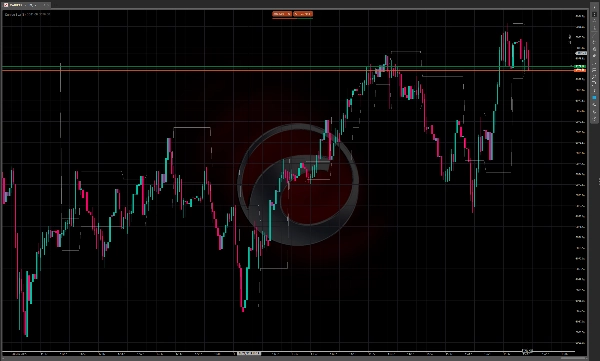
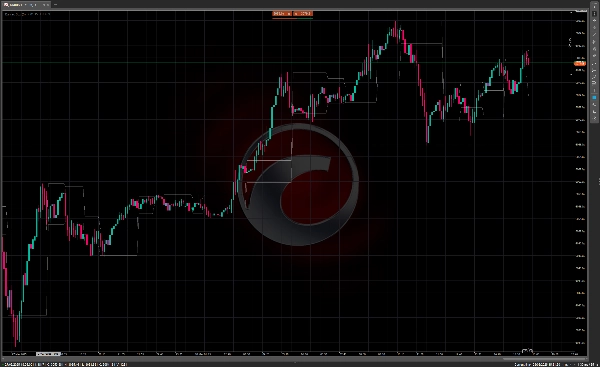
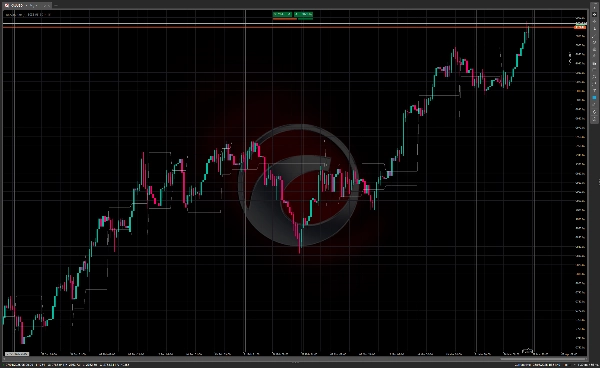
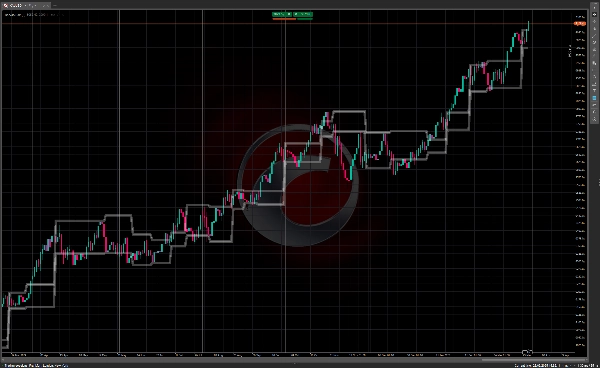
Metoda Darvas Box polega na identyfikacji „pudełek” lub zakresów handlowych, w których cena akcji konsoliduje się przed wybiciem. Kluczowe elementy to:
- Cena tworzy określony zakres handlowy („pudełko”) z wyraźnymi górnymi i dolnymi granicami
- Górna granica reprezentuje opór, podczas gdy dolna granica działa jako wsparcie
- Wybicie powyżej pudełka sygnalizuje potencjalną okazję do kupna
- Spadek poniżej pudełka może być wykorzystany jako sygnał sprzedaży
Traderzy stosujący tę technikę zazwyczaj szukają akcji wykazujących rosnący wolumen wraz z ruchem cen, ponieważ sugeruje to silniejsze momentum stojące za wybiciem.
Historia teorii Darvas Box
Nicolas Darvas (1920-1977) był dość niezwykłą postacią w historii handlu. Urodzony na Węgrzech, nie był profesjonalnym traderem z wykształcenia, lecz tancerzem występującym w duecie tanecznym „Darvas i Julia” ze swoją przyrodnią siostrą.
Podczas światowego tournée ze swoją grupą taneczną w latach 50., Darvas zaczął eksperymentować z handlem akcjami. Jego okoliczności były wyjątkowe – często podejmował decyzje inwestycyjne wyłącznie na podstawie tabel giełdowych w gazetach dostarczanych mu w różnych miastach podczas trasy.
Darvas opracował swoją teorię pudełek metodą prób i błędów. Początkowo tracił pieniądze na rynkach, ale stopniowo udoskonalał swoje podejście. W latach 1956-1958 podobno zamienił inwestycję 10 000 dolarów na ponad 2 miliony dolarów, stosując swoją metodę pudełek – niezwykłe osiągnięcie, które przyciągnęło uwagę.
W 1960 roku Darvas opublikował swoje metody w książce „Jak zarobiłem 2 000 000 dolarów na giełdzie”, która stała się klasykiem literatury handlowej. Książka szczegółowo opisywała jego drogę i wyjaśniała teorię pudełek, przynosząc tę metodę do głównego nurtu.
To, co wyróżniało metodę Darvasa, to jej prostota oraz fakt, że została opracowana przez osobę spoza branży finansowej. Skupiał się głównie na ruchach cen i wolumenie, a nie na analizie fundamentalnej, co było wówczas dość nowatorskim podejściem, które od tego czasu wpłynęło na wiele systemów handlu technicznego.
Technika Darvas Box pozostaje dziś popularna wśród traderów technicznych, zwłaszcza tych, którzy stosują strategie oparte na momentum na rynkach trendowych.