
Chaikin Money Flow
Gösterge
130 i̇ndirmeler
Sürüm 1.0, Dec 2024
Windows, Mac
5.0
Değerlendirmeler: 1
Açıklama
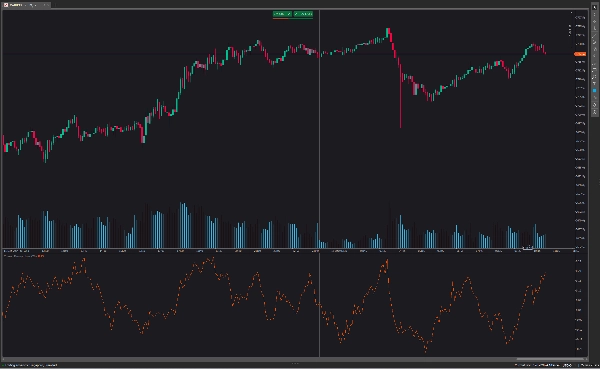
Chaikin para akışının temel amacı bir menkul kıymetin birikim ve dağıtım dönemlerini ayırt etmektir. Gösterge sıfır çizgisinin üzerindeyse, menkul kıymetin net birikim yaşadığını ve yatırımcıların varlığı satın aldığını gösterir.
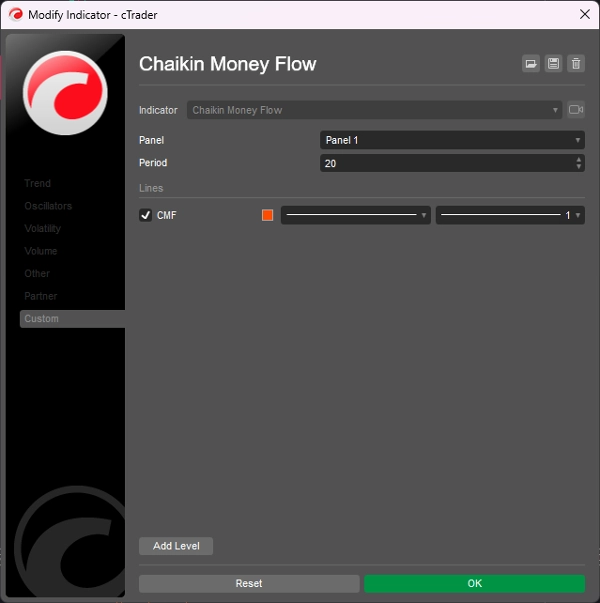
- 30'un üzerindeki Chaikin Para Akışı ayarları göstergenin duyarlılığını azaltır. Bu, daha az ancak daha kaliteli sinyallerle sonuçlanır.
- 20'nin altındaki Chaikin Para Akışı ayarları göstergenin aşırı duyarlı olmasına neden olur. Bu da daha fazla piyasa gürültüsü yaratır.
- CMF göstergesi sıfır çizgisini yukarıdan aşağıya geçtiğinde ve uzun/alım sinyalleri ürettiğinde devam eden bir yükseliş trendini gösterir.
- CMF göstergesi sıfır çizgisini aşağıdan yukarıya geçtiğinde ve kısa/satış sinyalleri ürettiğinde devam eden bir düşüş trendini gösterir.
Özet
YZ özeti
The Chaikin Money Flow (CMF) indicator is designed to identify periods of accumulation and distribution for a security. When the CMF value is above zero, it signals net accumulation, indicating buying pressure. Conversely, values below zero suggest distribution or selling pressure. The indicator’s sensitivity can be adjusted: settings above 30 reduce sensitivity, producing fewer but higher-quality signals, while settings below 20 increase sensitivity, resulting in more market noise. Key signals include a continued uptrend when the CMF crosses the zero line from above, generating buy signals, and a continued downtrend when it crosses from below, generating sell signals. This tool helps traders assess buying and selling momentum to inform trading decisions.
Gösterge profili
Müşteri değerlendirmeleri
5.0
Değerlendirmeler: 1
5 | 100 % | |
4 | 0 % | |
3 | 0 % | |
2 | 0 % | |
1 | 0 % |
Müşteri değerlendirmeleri
August 18, 2025
Reliable volume-based trend confirmation, easy to read, customizable period. Cons: No alerts, no MTF analysis, limited filtering options.
Tartışma
SSS
cTrader Store üzerinden erişilebilen işlem botları, göstergeler ve eklentiler gibi ürünler, üçüncü taraf sağlayıcılar tarafından sağlanır ve yalnızca bilgilendirme ve teknik erişim amaçlarıyla sunulur. cTrader Store bir broker değildir ve yatırım tavsiyesi, kişisel öneriler vermez veya gelecekteki performansı garanti etmez.
Bu oluşturanın diğer ürünleri


!["[Hamster-Coder] Moving Average MTF" logosu](https://cdn.ctrader.com/image/webp/b11b98b1-194d-4b8e-b00e-d611826ad159_31226)


Fiyat
2
Satışlar
6.9K
Ücretsiz yüklemeler