
Laguerre RSI
Indikator
648 downloads
Version 1.0, Oct 2024
Windows, Mac
5.0
Bewertungen: 1
Beschreibung
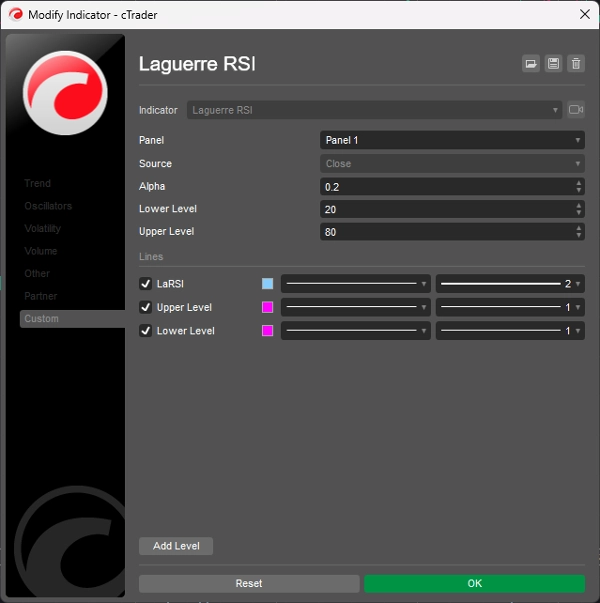
Laguerre RSI basiert auf John EHLERS' Laguerre-Filter, um das Rauschen des RSI zu vermeiden.
Ändern Sie den Alpha-Koeffizienten, um Verzögerung und Glätte zu erhöhen/zu verringern.
the
Kaufen, wenn der Laguerre RSI nach oben über 20 kreuzt.
Verkaufen, wenn der Laguerre RSI nach unten unter 80 kreuzt.
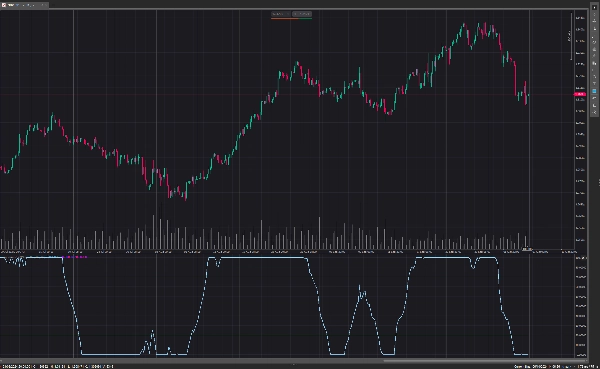
Wenn der Indikator flach über 80 verläuft, ist ein Aufwärtstrend stark.
Wenn der Indikator flach unter dem Niveau 20 verläuft, bedeutet dies, dass ein Abwärtstrend stark ist.
Zusammenfassung
KI-Zusammenfassung
Laguerre RSI is a technical indicator based on John Ehlers' Laguerre Filter designed to reduce the noise commonly found in traditional Relative Strength Index (RSI) calculations. It allows users to adjust the alpha coefficient to control the lag and smoothness of the indicator, tailoring its responsiveness to market conditions. The indicator generates buy signals when the Laguerre RSI crosses upward above the 20 level and sell signals when it crosses downward below the 80 level. Additionally, a flat reading above 80 indicates a strong uptrend, while a flat reading below 20 signals a strong downtrend. This indicator is used to identify trend strength and potential entry and exit points by filtering out market noise inherent in standard RSI measurements.
Indikatorprofil
Kundenbewertungen
5.0
Bewertungen: 1
5 | 100 % | |
4 | 0 % | |
3 | 0 % | |
2 | 0 % | |
1 | 0 % |
Kundenbewertungen
July 14, 2025
Pros: Smooths RSI using Laguerre filter, reducing noise and lag. Clear overbought/oversold levels. Great for scalping. Cons: No alerts or tooltips. Requires confirmation with trend filters. Lacks setting templates and advanced features.
Diskussion
Häufig gestellte Fragen (FAQ)
RSI
Über den cTrader Store verfügbare Produkte, einschließlich Handelsbots, Indikatoren und Plugins, werden von externen Entwicklern bereitgestellt und nur zu Informations- und technischen Zugriffszwecken verfügbar gemacht. cTrader Store ist kein Broker und erbringt keine Anlageberatung, persönlichen Empfehlungen oder eine Garantie für zukünftige Performance.
Mehr von diesem Autor


Preis
2
Verkäufe
6.9K
Kostenlose Installationen