
Chaikin Money Flow
Indikator
130 muat turun
Versi 1.0, Dec 2024
Windows, Mac
5.0
Ulasan: 1
Penerangan
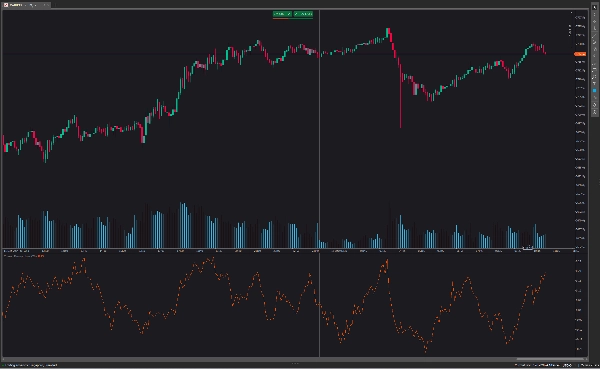
Tujuan utama aliran wang Chaikin adalah membezakan antara tempoh pengumpulan dan pengedaran sekuriti. Apabila penunjuk berada di atas garis sifar, ia menunjukkan sekuriti mengalami pengumpulan bersih, mencadangkan bahawa pelabur sedang membeli aset tersebut.
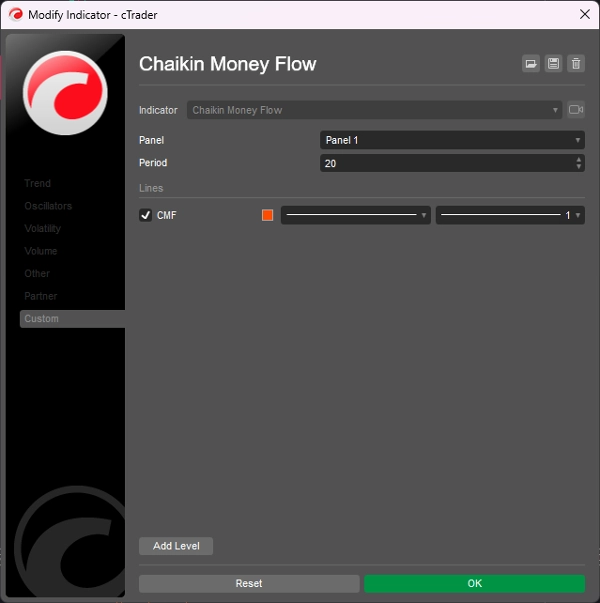
- Tetapan Chaikin Money Flow dengan nilai melebihi 30 menjadikan penunjuk kurang sensitif. Ini akan menghasilkan isyarat yang lebih sedikit, tetapi berkualiti lebih baik.
- Tetapan Chaikin Money Flow dengan nilai di bawah 20 menjadikan penunjuk terlalu sensitif. Ini akan menghasilkan lebih banyak bunyi pasaran.
- Ia menunjukkan tren menaik berterusan apabila penunjuk CMF melintasi garis sifar dari atas dan menghasilkan isyarat beli/panjang.
- Ia menunjukkan tren menurun berterusan apabila penunjuk CMF melintasi garis sifar dari bawah dan menghasilkan isyarat jual/pendek.
Ringkasan
Ringkasan AI
The Chaikin Money Flow (CMF) indicator is designed to identify periods of accumulation and distribution for a security. When the CMF value is above zero, it signals net accumulation, indicating buying pressure. Conversely, values below zero suggest distribution or selling pressure. The indicator’s sensitivity can be adjusted: settings above 30 reduce sensitivity, producing fewer but higher-quality signals, while settings below 20 increase sensitivity, resulting in more market noise. Key signals include a continued uptrend when the CMF crosses the zero line from above, generating buy signals, and a continued downtrend when it crosses from below, generating sell signals. This tool helps traders assess buying and selling momentum to inform trading decisions.
Profil indikator
Ulasan pelanggan
5.0
Ulasan: 1
5 | 100 % | |
4 | 0 % | |
3 | 0 % | |
2 | 0 % | |
1 | 0 % |
Ulasan pelanggan
August 18, 2025
Reliable volume-based trend confirmation, easy to read, customizable period. Cons: No alerts, no MTF analysis, limited filtering options.
Perbincangan
Soalan Lazim
Produk yang tersedia melalui cTrader Store, termasuk bot dagangan, indikator dan plugin, disediakan oleh pembangun pihak ketiga dan diberikan akses untuk tujuan maklumat dan teknikal sahaja. cTrader Store bukan broker dan tidak memberikan nasihat pelaburan, syor peribadi atau sebarang jaminan prestasi masa hadapan.
Lebih banyak produk daripada penulis ini


Harga
2
Jualan
6.9K
Pemasangan percuma