
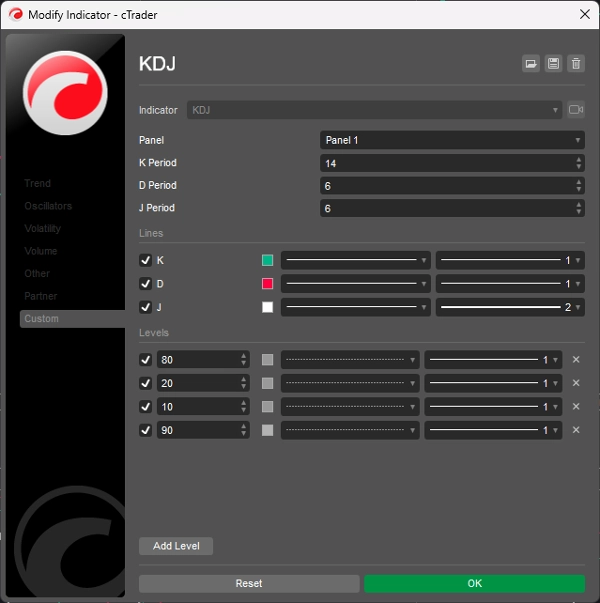
KDJ
Indikator
255 muat turun
Versi 1.0, Dec 2024
Windows, Mac
5.0
Ulasan: 1
Penerangan
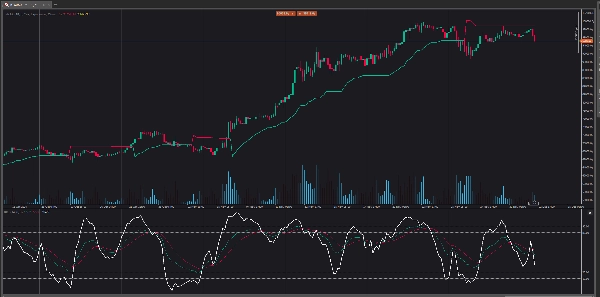
Paparan pengayun KDJ terdiri daripada 3 garis (K, D dan J - oleh itu nama paparan) dan 2 tahap. K dan D adalah garis yang sama apabila menggunakan pengayun stokastik. Garis J mewakili penyimpangan nilai D daripada nilai K. Perhimpunan garis-garis ini menunjukkan peluang dagangan baru. Seperti Pengayun Stokastik, tahap terlebih jual dan terlebih beli bersesuaian dengan masa apabila trend mungkin akan berbalik.
Ringkasan
Ringkasan AI
The KDJ indicator is an oscillator consisting of three lines: K, D, and J, along with two reference levels. The K and D lines correspond to those used in the stochastic oscillator, while the J line measures the deviation of the D value from the K value. This convergence of the three lines is used to identify potential new trading opportunities. Similar to the stochastic oscillator, the KDJ indicator highlights overbought and oversold conditions, which often signal possible trend reversals. This tool is designed to assist traders in timing entries and exits by analyzing momentum and trend strength through these oscillating lines.
Profil indikator
Ulasan pelanggan
5.0
Ulasan: 1
5 | 100 % | |
4 | 0 % | |
3 | 0 % | |
2 | 0 % | |
1 | 0 % |
Ulasan pelanggan
August 18, 2025
Pros: Three-line stochastic oscillator (K, D, J) that identifies overbought/oversold levels and momentum shifts. Supports divergence analysis and crossovers between K and D as trading signals. Lightweight and responsive. Cons: No alerts, tooltips, or settings presets. J‑line can generate outlier v
Perbincangan
Soalan Lazim
Produk yang tersedia melalui cTrader Store, termasuk bot dagangan, indikator dan plugin, disediakan oleh pembangun pihak ketiga dan diberikan akses untuk tujuan maklumat dan teknikal sahaja. cTrader Store bukan broker dan tidak memberikan nasihat pelaburan, syor peribadi atau sebarang jaminan prestasi masa hadapan.
Lebih banyak produk daripada penulis ini


Harga
2
Jualan
6.9K
Pemasangan percuma