
support and resistance
Indicatore
13 acquisti
Versione 1.0, Jun 2025
Windows, Mac
4.3
Recensioni: 3
Caratteristiche principali:
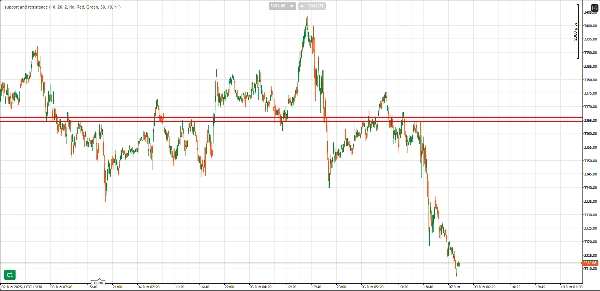
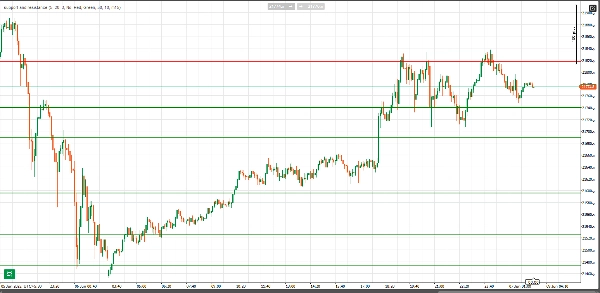
- Rilevamento automatico di supporti e resistenze: L'indicatore identifica automaticamente livelli significativi di supporto e resistenza basati sull'azione del prezzo, evidenziando queste zone dove il prezzo si è invertito o è rimasto fermo più volte.
- Validazione del conteggio dei rimbalzi: I livelli di supporto e resistenza sono convalidati in base al numero di rimbalzi (reazioni del prezzo) dal livello. Più rimbalzi ci sono, più forte è il livello. È possibile regolare il conteggio minimo dei rimbalzi affinché un livello sia considerato valido, assicurando che vengano segnati solo livelli altamente significativi.
- Stili di linea regolabili: Lo spessore e lo stile delle linee di supporto e resistenza sono automaticamente regolati in base al conteggio dei rimbalzi. I livelli con più rimbalzi sono disegnati con linee più spesse e più evidenti, enfatizzandone visivamente l'importanza.
- Larghezza della zona (Pips): È possibile definire una zona di buffer intorno ai livelli di supporto e resistenza in pips. Questo aiuta a identificare l'azione del prezzo all'interno di un intervallo dove il prezzo potrebbe potenzialmente invertire o reagire.
- Filtro di timeframe superiore: Una caratteristica unica di questo indicatore è la sua capacità di convalidare i livelli di supporto e resistenza utilizzando un filtro di timeframe superiore. Selezionando un timeframe superiore (ad esempio, 1H, 4H), l'indicatore verifica i livelli identificati rispetto all'azione chiave del prezzo nel timeframe superiore, assicurando che vengano disegnati sul grafico solo livelli significativi.
- Avvisi: Quando il prezzo entra nella zona di un livello di supporto o resistenza, l'indicatore può avvisarti con un suono audio, così non perderai mai una reazione importante del prezzo.
- Colori personalizzabili: Puoi facilmente cambiare il colore delle linee di supporto e resistenza per adattarle alle tue preferenze o al tema del tuo trading.
- Prevenzione delle sovrapposizioni: L'indicatore include un filtro di soglia che impedisce di disegnare livelli di supporto e resistenza sovrapposti troppo vicini tra loro, assicurando che vengano mostrati solo livelli unici e importanti.
Vantaggi:
- Risparmio di tempo: Rileva e visualizza automaticamente i principali livelli di supporto e resistenza senza doverli disegnare manualmente.
- Visualizzazioni chiare: Vedi facilmente quali livelli di supporto e resistenza sono i più significativi basati sui rimbalzi del prezzo e sulla convalida del timeframe superiore.
- Avvisi efficaci: Ricevi avvisi tempestivi quando l'azione del prezzo entra in livelli importanti, aiutandoti ad agire rapidamente ed efficacemente.
- Decisioni di trading migliorate: Usa questo indicatore per acquisire maggiore fiducia nelle tue entrate e uscite, così come nella tua analisi tecnica complessiva.
Opzioni di personalizzazione:
- Barre di lookback: Regola quanto indietro l'indicatore guarda per identificare potenziali livelli di supporto e resistenza.
- Rimbalzi minimi: Imposta il numero minimo di rimbalzi richiesti affinché un livello sia considerato valido.
- Timeframe superiore: Filtra i livelli di supporto e resistenza basandoti su un timeframe superiore (ad esempio, grafici a 1 ora, 4 ore).
- Colore della linea: Scegli i colori per le linee di resistenza e supporto per adattarle allo stile del tuo grafico.
- Impostazioni degli avvisi: Abilita o disabilita gli avvisi basati sull'ingresso del prezzo nelle zone di supporto o resistenza.
Profilo indicatore
Categoria indicatore
Supporto e resistenza
Tipo di output
Visualizzazione
Requisiti per i dati
Solo barre
Segnali supportati
Rottura
Inversione
4.3
Recensioni: 3
5 | 33 % | |
4 | 67 % | |
3 | 0 % | |
2 | 0 % | |
1 | 0 % |
Recensioni dei clienti
June 11, 2025
Nice setup companion for a more controlled workflow. It helps with planning entries and exits around important areas, but not every zone holds, even if it looks clean. The cleanest use is 3 to 5 levels per chart, with 0.5 pullbacks checked before entry. I would still keep manual review in the process.
June 10, 2025
June 10, 2025
Decent option for checks around key price zones. The useful part is planning entries and exits around important areas, with the numbers checked before scaling. I would wait for 2 reactions and avoid trades where the target is less than 1.5R. Levels are useful when they reduce noise, not when they crowd the chart.
BTCUSD
Prop
Forex
Breakout
Indices
EURUSD
Commodities
GBPUSD
NZDUSD
XAUUSD
NAS100
USDJPY
I prodotti disponibili tramite cTrader Store, inclusi bot di trading, indicatori e plugin, sono forniti da sviluppatori terzi e resi disponibili esclusivamente a scopo informativo e di accesso tecnico. cTrader Store non è un broker e non fornisce consulenze in materia di investimento, raccomandazioni individualizzate o garanzie di risultati futuri.


![Logo di "[Hamster-Coder] Moving Average MTF"](https://cdn.ctrader.com/image/webp/b11b98b1-194d-4b8e-b00e-d611826ad159_31226)


Da 30/05/2025
40
Vendite