
Pivot Point Daily Indicator
Indicatore
14 acquisti
Versione 2.0, May 2026
Windows, Mac
4.2
Recensioni: 4
Descrizione
Caratteristiche principali:
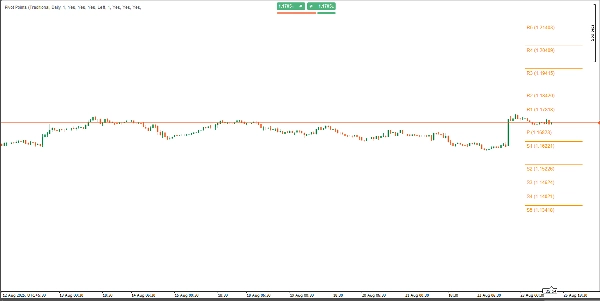
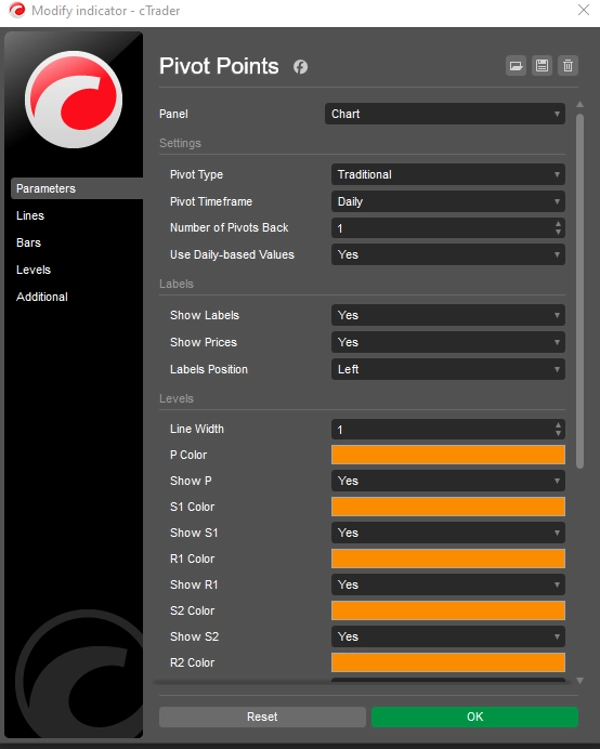
- Molteplici stili di Pivot: Passa senza problemi tra sei metodi di calcolo dei pivot: Classico, Fibonacci, Woodie, Camarilla, DM e Tradizionale. Ogni metodo supporta livelli variabili (fino a R5/S5 per Tradizionale e Camarilla, R3/S3 per Fibonacci, e P/R1/S1 per DM).
- Intervalli di tempo flessibili: Scegli tra un'ampia gamma di intervalli temporali per i pivot, inclusi Auto, Giornaliero, Settimanale, Mensile, Trimestrale, Annuale e opzioni multi-anno (Biennale, Triennale, Quinquennale, Decennale). Perfetto per allinearsi al tuo orizzonte di trading.
- Controllo storico dei pivot: Imposta il numero di set storici di pivot da visualizzare (1–200) con il parametro Numero di Pivot Indietro, garantendo un grafico ordinato preservando i livelli storici chiave.
- Aspetto personalizzabile: Colori, larghezze delle linee e impostazioni delle etichette completamente regolabili. Attiva o disattiva etichette e valori di prezzo, e scegli la posizione delle etichette (Sinistra o Destra) con offset verticali intelligenti per chiarezza.
- Dati giornalieri o intraday: Opzione per utilizzare valori basati sul giornaliero o dati dell'intervallo temporale del grafico, offrendo flessibilità per diverse strategie di trading.
- Prestazioni ottimizzate: Codice nativo leggero per cTrader che garantisce aggiornamenti rapidi in tempo reale senza ritardi, compatibile con Forex, indici, materie prime, criptovalute e altro.
Perché scegliere Pivot Points Standard?
- Strumento di trading versatile: Identifica livelli chiave di supporto/resistenza, direzioni di tendenza e opportunità di breakout in qualsiasi mercato o intervallo temporale.
- Interfaccia user-friendly: Menu a discesa intuitivi per tipo di pivot, intervallo temporale e posizione delle etichette rendono la personalizzazione semplice.
- Analisi storica: Visualizza fino a 200 set storici di pivot per studiare le interazioni passate dei prezzi e perfezionare la tua strategia.
- Grafici puliti: Posizionamento intelligente delle etichette e lunghezze delle linee personalizzabili prevengono l'affollamento del grafico, migliorando la leggibilità.
Come usare:
- Applica l'indicatore al tuo grafico cTrader.
- Seleziona il tuo tipo di Pivot preferito (es. Fibonacci, Camarilla) e l'intervallo temporale del Pivot (es. Giornaliero, Mensile).
- Regola il Numero di Pivot Indietro per controllare i set storici visualizzati.
- Personalizza colori, larghezze delle linee e impostazioni delle etichette secondo il tuo stile.
- Usa i livelli di pivot per identificare supporto/resistenza, impostare stop-loss/take-profit o operare sui breakout.
Ideale per:
- Day Trader: Sfrutta i pivot Giornalieri o Settimanali per entrate e uscite intraday.
- Swing Trader: Usa i pivot Mensili o Trimestrali per catturare tendenze a lungo termine.
- Scalper: Combina con intervalli temporali inferiori per operazioni rapide e precise.
- Tutti i mercati: Funziona perfettamente su Forex, azioni, criptovalute e materie prime.
Aumenta la tua fiducia nel trading
Con Pivot Points Standard, hai accesso a uno strumento potente e tutto-in-uno che semplifica l'analisi tecnica e migliora la tua capacità di individuare opportunità di trading ad alta probabilità. Che tu sia un principiante o un trader esperto, questo indicatore si adatta alla tua strategia, fornendo livelli chiari e azionabili per elevare il tuo trading.Prova oggi Pivot Points Standard e prendi il controllo del tuo trading con precisione e chiarezza!Pagamento una tantum. Accesso a vita. Aggiornamenti futuri inclusi.
Riepilogo
Riepilogo AI
Pivot Point Daily Indicator is a multi-timeframe pivot point tool designed for the cTrader platform. It supports six pivot calculation methods—Classic, Fibonacci, Woodie, Camarilla, DM, and Traditional—each offering various resistance and support levels (up to R5/S5 for some methods). Users can select from a broad range of timeframes including Auto, Daily, Weekly, Monthly, Quarterly, Yearly, and multi-year intervals, allowing alignment with different trading horizons.
The indicator allows displaying up to 200 historical pivot sets to analyze past price interactions while maintaining chart clarity through customizable label positions and line settings. It offers options to use daily-based or intraday data, enhancing flexibility for diverse trading strategies.
Pivot Point Daily Indicator is optimized for real-time performance with native cTrader coding, compatible across Forex, indices, commodities, cryptocurrencies, and other markets. Its interface includes intuitive dropdown menus for pivot type, timeframe, and label customization.
Traders can use this indicator to identify key support and resistance levels, trend directions, and breakout opportunities, aiding in setting stop-loss and take-profit points. It suits various trading styles including day trading, swing trading, and scalping across multiple asset classes.
Profilo indicatore
Categoria indicatore
Supporto e resistenza
Tipo di output
Filtro
Requisiti per i dati
Solo barre
Segnali supportati
Livello rotto
Recensioni dei clienti
4.2
Recensioni: 4
5 | 25 % | |
4 | 75 % | |
3 | 0 % | |
2 | 0 % | |
1 | 0 % |
Recensioni dei clienti
May 2, 2026
Bought it, added it, used it for a while, and now it's disappeared, and I cannot get it back!
August 28, 2025
Good helper for review if the trader wants it keeps attention on levels that actually matter. It works best as support, not a final decision maker. The cleanest use is 3 to 5 levels per chart, with 0.5 pullbacks checked before entry. not every zone holds, even if it looks clean.
August 27, 2025
August 27, 2025
Usable tool with purpose for traders who build plans around market levels. It gives value around key price zones, but not every zone holds, even if it looks clean. I would wait for 2 reactions and avoid trades where the target is less than 1.5R. Levels are useful when they reduce noise, not when they crowd the chart.
Discussioni
Domande frequenti
Fibonacci
Prop
Forex
Breakout
Indices
Commodities
I prodotti disponibili tramite cTrader Store, inclusi bot di trading, indicatori e plugin, sono forniti da sviluppatori terzi e resi disponibili esclusivamente a scopo informativo e di accesso tecnico. cTrader Store non è un broker e non fornisce consulenze in materia di investimento, raccomandazioni individualizzate o garanzie di risultati futuri.


Prezzo
Da 30/05/2025
40
Vendite