
Descrizione
⚡ Caratteristiche principali
- Rilevamento dinamico delle zone
-
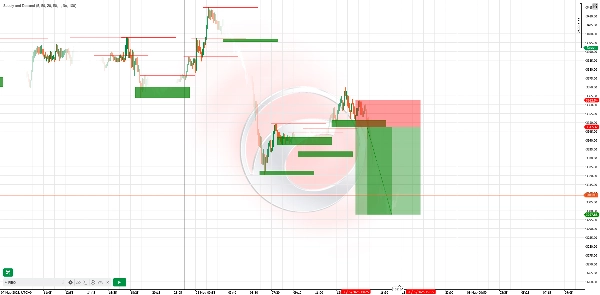
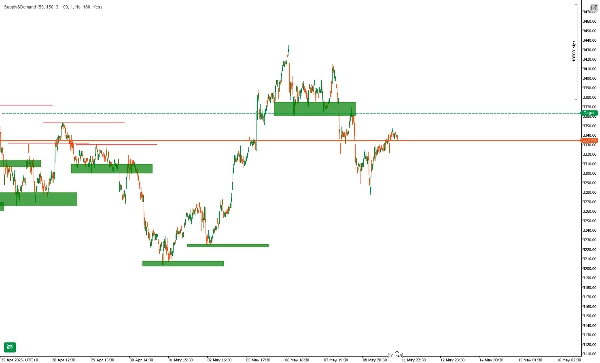
- Rileva automaticamente i massimi/minimi oscillanti e disegna in tempo reale le zone di offerta (resistenza) e domanda (supporto).
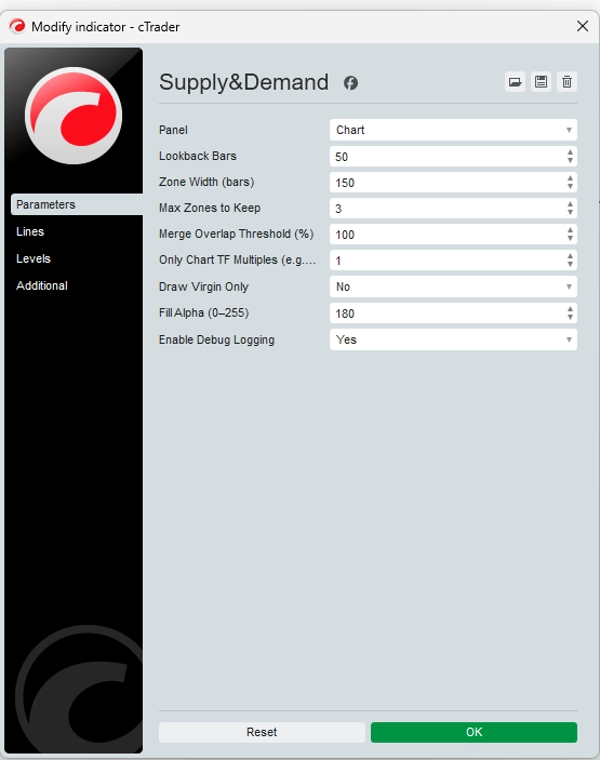
- Parametri configurabili di lookback e larghezza della zona ti permettono di adattare la sensibilità a qualsiasi mercato o timeframe.
- Evidenziazione delle zone vergini
-
- Le zone “vergini” fresche (mai toccate dal prezzo) sono evidenziate visivamente—trada dove le istituzioni hanno lasciato ordini.
- Opzionalmente nascondi le zone toccate per mantenere il grafico ordinato.
- Filtraggio multi-timeframe
-
- Mostra solo le zone che corrispondono al multiplo del timeframe del tuo grafico (es. mostra zone giornaliere sul grafico a 1 ora).
- Vedi rapidamente la confluenza di offerta/domanda a timeframe superiore con il tuo setup intraday.
- Non ridisegna e non ritarda
-
- Le zone sono fisse una volta disegnate—nessuna linea scompare o si sposta dopo che il prezzo si muove.
- Affidabilità testata: le zone rimangono statiche, dandoti fiducia nell’analisi storica.
- Avvisi personalizzati e registrazione
-
- Ricevi avvisi pop-up o email quando il prezzo entra o rompe una zona.
- Registro dettagliato di debug mostra creazione delle zone, sovrapposizioni saltate e tocchi delle zone.
🚀 Come funziona
- Rilevamento pivot: L’indicatore analizza ogni nuova barra per massimi pivot (offerta) e minimi pivot (domanda) basandosi sul lookback scelto.
- Costruzione della zona: Per ogni pivot viene disegnata una zona rettangolare che si estende in avanti—evidenziando dove probabilmente le istituzioni hanno piazzato ordini limite.
- Filtraggio delle sovrapposizioni: Le zone che si sovrappongono oltre la soglia vengono unite o saltate, assicurando che rimangano solo le aree più significative.
- Opzione solo zone vergini: Mantieni visibili solo le zone intatte per concentrarti sui livelli istituzionali più freschi.
🎯 Esempi di strategie di trading
StrategiaTimeframeEntrataStop‑LossTake‑Profit
Rifiuto della zona
H1
Aspetta che il prezzo salga in una zona di domanda e mostri una candela ribassista (engulfing/pin bar) nella zona di offerta
Poco oltre il confine della zona
1,5× altezza della zona
Confluenza di TF
M15 + H4
Identifica la zona di domanda H4, poi passa a M15 per una candela di momentum rialzista all’interno di quella zona
Sotto il minimo della zona H4
Prossimo massimo oscillante H4
Rottura e retest
H4
Dopo che il prezzo rompe una zona di offerta, aspetta il retest del lato inferiore della zona e una conferma ribassista
Sopra il massimo della zona
Minimo recente H4
Suggerimento d’uso: Combina con divergenza RSI o MACD all’interno delle zone per segnali a probabilità più alta.
📈 Esempio reale
- Su EURUSD H4, l’indicatore disegna una zona di domanda a 1.0950–1.0980.
- Il prezzo scende nella zona, stampa una candela engulfing rialzista M15.
- Entrata a 1.0970, stop a 1.0945 (sotto la zona), target a 1.1040 (prossima resistenza H4).
- Risultato: +70 pips (~6,4× rischio).
⚠️ Disclaimer
Questo indicatore è uno strumento—non un sistema di profitto garantito. Le performance passate non assicurano risultati futuri. Usa sempre una gestione del rischio adeguata (es. max 2% per trade), testa prima su un conto demo e combina con la tua analisi. Il trading comporta rischio di perdita; investi solo capitale che puoi permetterti di perdere.
Riepilogo
It supports multi-timeframe filtering, allowing users to display zones aligned with higher timeframe multiples on lower timeframe charts, facilitating confluence analysis. Zones are non-repainting and non-lagging; once drawn, they remain fixed, ensuring reliable historical analysis. Custom alerts notify users when price enters or breaks these zones, and detailed logs track zone creation and interactions.
The indicator operates by scanning each new bar for pivot highs and lows, constructing rectangular zones extending forward, and filtering overlapping zones to retain the most significant areas. It offers a “virgin-only” mode to focus on fresh institutional levels.
Example strategies include zone rejection, multi-timeframe confluence, and break & retest setups, often combined with RSI or MACD divergence for higher-probability signals. A real-world example on EURUSD H4 demonstrates entry, stop-loss, and take-profit placement based on demand zones and candlestick confirmation.
Recensioni dei clienti
5 | 75 % | |
4 | 25 % | |
3 | 0 % | |
2 | 0 % | |
1 | 0 % |


