
Descrizione
Indicatore Avanzato di Supporto e Resistenza
Sblocca il potere dell'analisi tecnica con il nostro Indicatore Avanzato di Supporto e Resistenza per cAlgo. Questo strumento avanzato è progettato per aiutare i trader a identificare e visualizzare livelli critici di supporto e resistenza sui loro grafici di trading, migliorando il processo decisionale e le strategie di trading.
Caratteristiche principali:
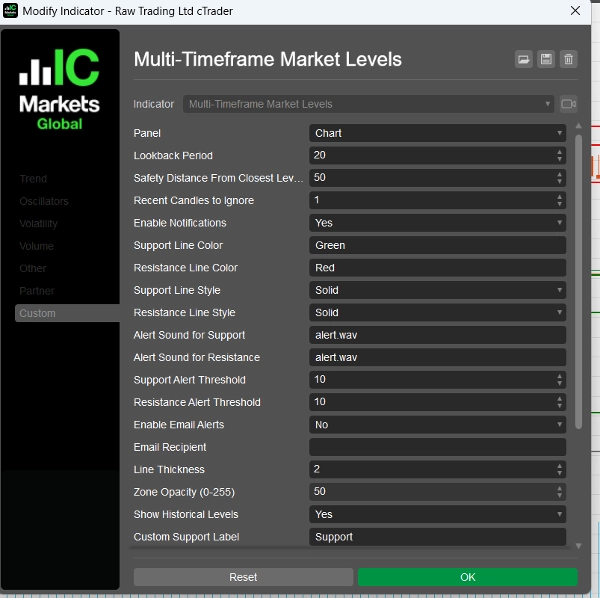
- Parametri Personalizzabili: Adatta l'indicatore al tuo stile di trading con impostazioni regolabili, inclusi periodi di lookback, distanze di sicurezza, suoni di allerta e altro ancora.
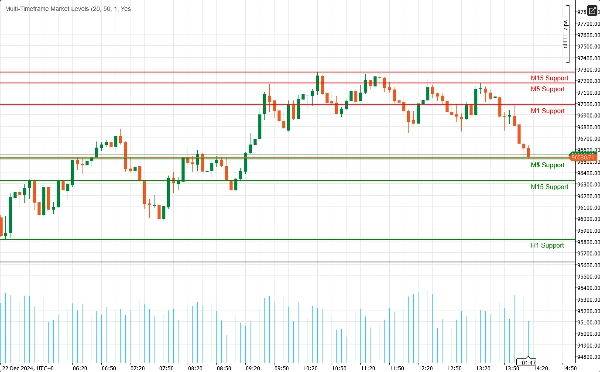
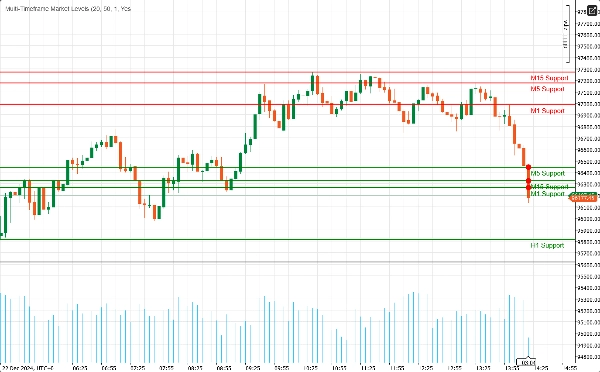
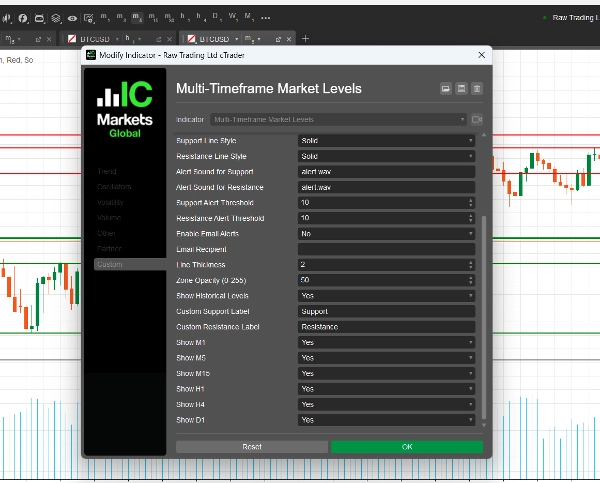
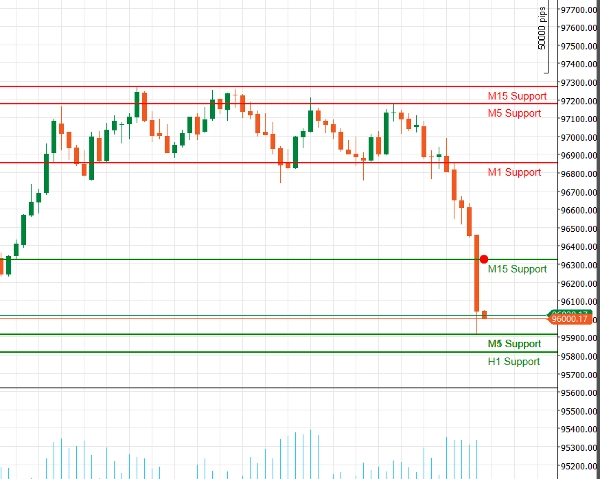
- Supporto Multi-Timeframe: Analizza più timeframe simultaneamente (M1, M5, M15, H1, H4, D1) per ottenere una visione completa della dinamica del mercato e identificare livelli chiave su diversi orizzonti di trading.
- Avvisi in Tempo Reale: Rimani informato con notifiche istantanee! L'indicatore può inviare avvisi audio e notifiche email quando il prezzo si avvicina a livelli critici di supporto o resistenza, assicurandoti di non perdere mai un'opportunità di trading.
- Chiarezza Visiva: Goditi rappresentazioni visive chiare dei livelli di supporto e resistenza, complete di colori personalizzabili e stili di linea. Le zone evidenziate forniscono un contesto aggiuntivo, facilitando l'individuazione di potenziali punti di inversione.
- Integrazione Fibonacci: Migliora la tua analisi con il disegno integrato dei livelli di Fibonacci, che ti permette di identificare potenziali livelli di ritracciamento ed estensione in combinazione con supporto e resistenza.
- Interfaccia Intuitiva: Progettato sia per trader principianti che esperti, l'indicatore è facile da configurare e si integra perfettamente nel tuo ambiente cAlgo esistente.
Come usare l'Indicatore Avanzato di Supporto e Resistenza
- Installazione:
-
- Scarica l'indicatore e importalo nella tua piattaforma cAlgo.
- Collega l'indicatore al grafico desiderato.
- Configura i Parametri:
-
- Regola le impostazioni per adattarle al tuo stile di trading. Imposta il periodo di lookback, la distanza di sicurezza e scegli i colori e gli stili di linea preferiti per i livelli di supporto e resistenza.
- Abilita le notifiche se desideri ricevere avvisi quando il prezzo si avvicina a questi livelli.
- Seleziona i Timeframe:
-
- Scegli quali timeframe vuoi visualizzare. Puoi decidere di mostrare o nascondere i livelli da M1, M5, M15, H1, H4 e D1, a seconda della tua strategia di trading.
- Analizza il Grafico:
-
- Osserva i livelli di supporto e resistenza tracciati sul tuo grafico. Questi livelli indicano dove il prezzo è probabile che si inverta o si consolidi.
Come fare trading con l'Indicatore Avanzato di Supporto e Resistenza
- Identificare i Punti di Entrata:
-
- Operazioni Long: Cerca opportunità di acquisto quando il prezzo si avvicina a un livello di supporto, specialmente se mostra segnali di rimbalzo (ad esempio, pattern di candele rialziste).
- Operazioni Short: Considera di vendere quando il prezzo si avvicina a un livello di resistenza, in particolare se ci sono segnali ribassisti (ad esempio, pattern di candele ribassiste).
- Utilizzo degli Avvisi:
-
- Utilizza gli avvisi in tempo reale per essere notificato quando il prezzo si avvicina a livelli chiave di supporto o resistenza. Questo ti permette di agire rapidamente e sfruttare potenziali opportunità di trading.
- Combinazione con Altri Indicatori:
-
- Migliora la tua strategia combinando l'Indicatore Avanzato di Supporto e Resistenza con altri indicatori tecnici (ad esempio, Medie Mobili, RSI, MACD) per confermare i segnali e migliorare la precisione delle tue operazioni.
- Impostazione di Stop-Loss e Take-Profit:
-
- Posiziona ordini stop-loss appena sotto i livelli di supporto per le operazioni long e appena sopra i livelli di resistenza per le operazioni short per gestire il rischio.
- Imposta obiettivi di take-profit al prossimo livello significativo di supporto o resistenza per massimizzare i guadagni potenziali.
Perché scegliere l'Indicatore Avanzato di Supporto e Resistenza?
Navigare nelle complessità dei mercati finanziari può essere impegnativo. L'Indicatore Avanzato di Supporto e Resistenza ti fornisce gli strumenti necessari per identificare livelli di prezzo chiave e prendere decisioni di trading informate. Che tu sia un trader giornaliero o un investitore a lungo termine, questo indicatore è un'aggiunta essenziale al tuo kit di strumenti di trading.
Riepilogo
Recensioni dei clienti
5 | 100 % | |
4 | 0 % | |
3 | 0 % | |
2 | 0 % | |
1 | 0 % |


