
Açıklama
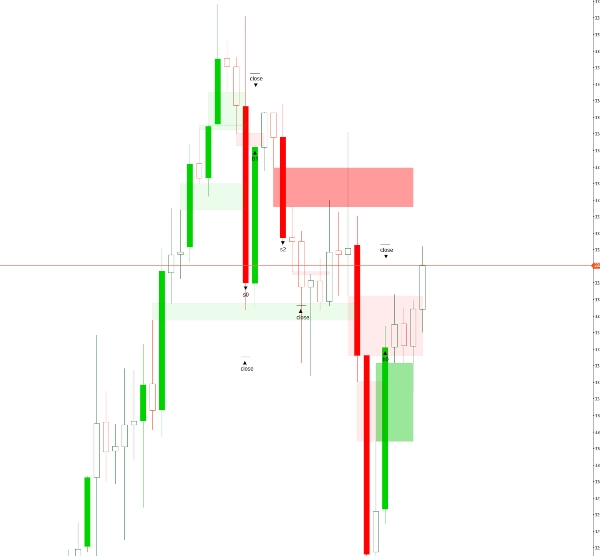
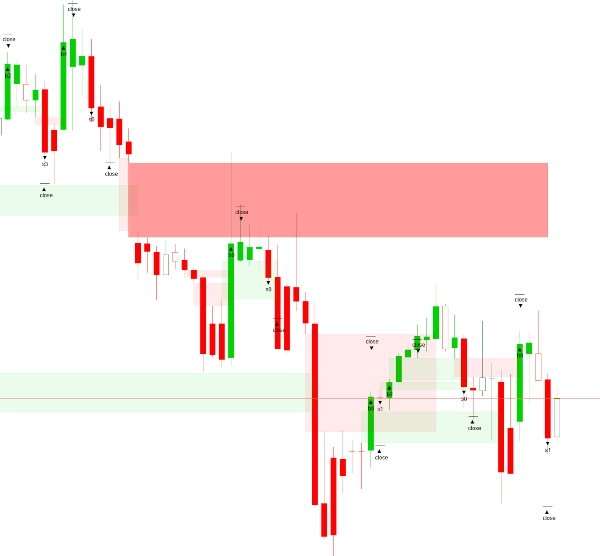
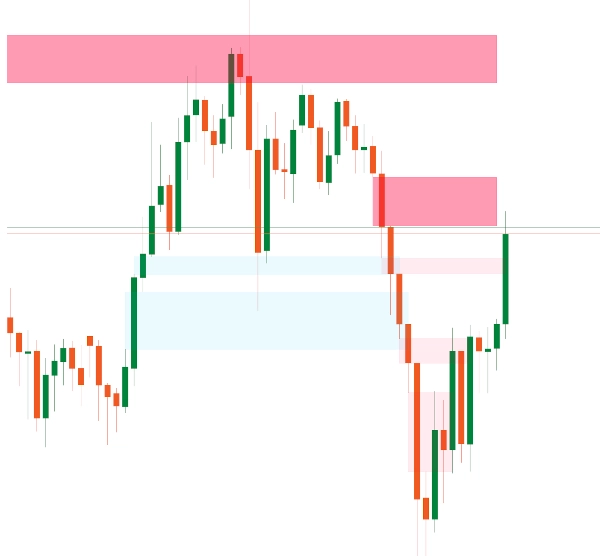
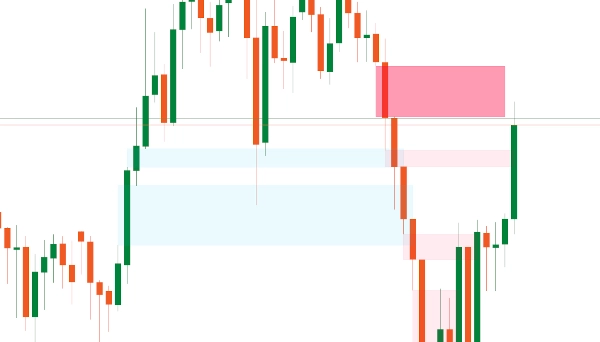
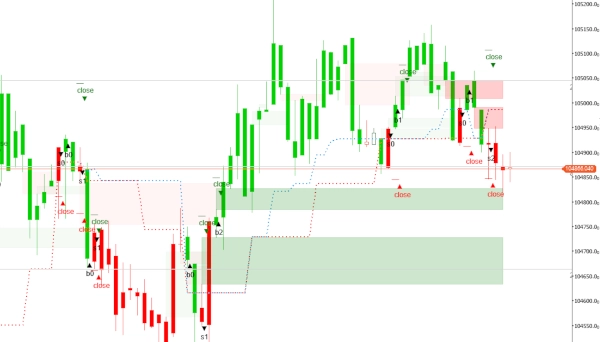
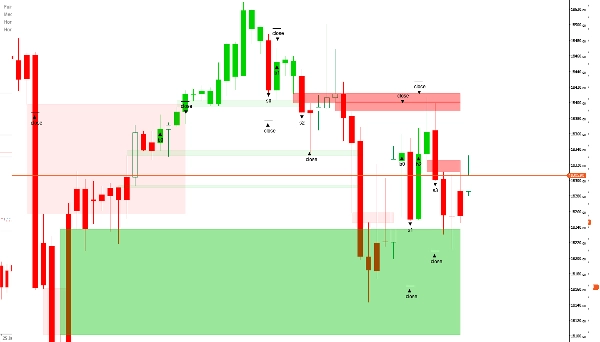
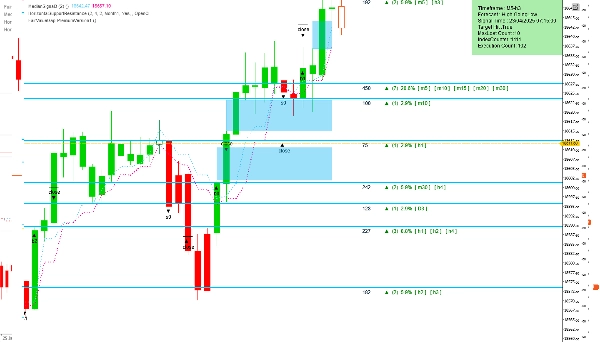
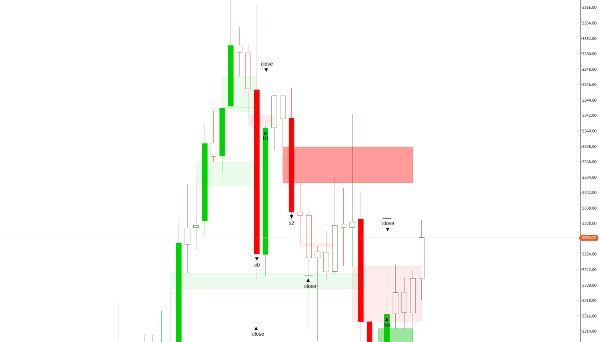
Bu Adil Değer Boşluğu (FVG) göstergesi, finansal piyasalardaki fiyat verimsizliklerini tespit etmek için tasarlanmış teknik analiz aracıdır. Fiyatın hızla yükseldiği veya düştüğü, geride az veya hiç işlem aktivitesi olmayan bir “boşluk” bıraktığı alanları belirler. Bu boşluklar genellikle arz ve talepte geçici bir dengesizliği işaret eder ve piyasa denge ararken fiyatın sonunda bu boşluğu “doldurabileceğini” gösterir. Genellikle, bir FVG, fiyat mumunun önceki mumun yüksek seviyesinin oldukça üzerinde veya düşük seviyesinin oldukça altında kapanması ve örtüşme olmaması durumunda tanınır; bu, potansiyel bir tepki alanını gösterir. Bu davranış genellikle kurumsal ticaret veya algoritmik faaliyetle ilişkilendirilir. Bu göstergenin çoğu versiyonu tek bir zaman dilimindeki dengesizlikleri analiz ederken, premium versiyon, daha yüksek veya daha düşük zaman dilimlerinden boşlukları tespit edip mevcut grafik üzerinde doğrudan göstererek çoklu zaman dilimi analizine daha derin bir bağlam sağlar.
Ayarlar Genel Bakış
- Yüklenecek Çubuk Sayısı: En son tamamlanan çubuktan başlayarak geriye doğru analiz edilecek tarihsel çubuk sayısını belirtir.
- Boğa FVG Rengi: Yükseliş trendinde görünen FVG'ler için renk ayarlar. Boşluğun arkasındaki öğelerin görünür kalması için %30 şeffaflık uygulanır.
- Ayı FVG Rengi: Düşüş trendinde görünen FVG'ler için renk ayarlar, grafik görünürlüğünü artırmak için %30 şeffaflık da uygulanır.
Premium Özellikler (Ücretli Versiyonda Mevcuttur)
- Kapanan Boşlukları Sil: Boolean ayar—etkinleştirildiğinde ("evet") tüm kapanan boşlukları otomatik olarak kaldırır; devre dışı bırakıldığında ("hayır") boşluklar görünür kalır. Bu özellikle 20 dakikanın altındaki daha düşük zaman dilimlerinde faydalıdır.
- Boşlukları Düzenle/Sil: Tüccarların boşlukları manuel olarak ayarlamasına veya silmesine olanak tanır. Bu, deneyimli tüccarlara daha fazla kontrol sağlar, çünkü çok küçük boşluklar genellikle fiyat hareketi üzerinde çok az etkiye sahiptir.
- Zaman Dilimi Ayarla: İki seçenek sunar—mevcut grafiğin zaman dilimini kullanmak veya analiz için farklı bir zaman dilimi seçmek ve sonuçları ana grafikte göstermek. Bu özellik, tüccarların olası piyasa hareketleri hakkında daha hızlı bilgi edinmelerine yardımcı olur.
- Seçilen Zaman Dilimi: Yukarıdaki ayarda "Seçilen Zaman Dilimi" seçilirse analiz için istenen zaman dilimini belirtir.
- Küçük Boşluk Doğruluğu: Tüccarların tercih ettikleri boşluk boyutunu tam sayı olarak girmesine olanak tanır; bu, tarihsel olarak olumlu sonuçlara yol açan boşlukları tanımlamalarına yardımcı olur. Değer, tüm veri seti ve varlık için gözlemlenen boşluk boyutlarına dayanır.
Varsayılan olarak, gösterge tek bir zaman dilimindeki tüm dengesizlikleri tarar. Ancak, FairValueGapPremium versiyonu aracılığıyla premium özelliklere erişim, analiz yeteneklerini büyük ölçüde artırabilir.
Özet
This indicator detects such gaps to highlight potential reaction zones. By default, it analyzes imbalances within a single timeframe. The premium version enhances functionality by allowing detection and display of FVGs from higher or lower timeframes directly on the current chart, supporting multi-timeframe analysis.
Key settings include the number of historical bars to analyze and customizable colors for bullish and bearish gaps with transparency for chart clarity. Premium features offer options to automatically delete closed gaps, manually edit or remove gaps, select analysis timeframes independent of the chart’s timeframe, and specify gap size accuracy to focus on significant gaps.
This tool aids traders in identifying price inefficiencies and probable market reaction areas through detailed gap analysis across multiple timeframes.
Müşteri değerlendirmeleri
5 | 100 % | |
4 | 0 % | |
3 | 0 % | |
2 | 0 % | |
1 | 0 % |


!["[Hamster-Coder] Pivot Points MTF" logosu](https://cdn.ctrader.com/image/webp/4c143e5a-309c-40e3-a578-f04d1e133ffa_31159)


