Mô tả
Chỉ báo Biểu đồ Cảm xúc Thanh này là một công cụ phân tích kỹ thuật đo lường sức mạnh và hướng đi của tâm lý thị trường trên cơ sở từng thanh (hoặc từng cây nến). Nó xem xét mối quan hệ giữa giá mở cửa, cao, thấp và đóng cửa của mỗi thanh để xác định liệu thị trường có biểu hiện xu hướng tăng, giảm hay trung lập trong khoảng thời gian đó.
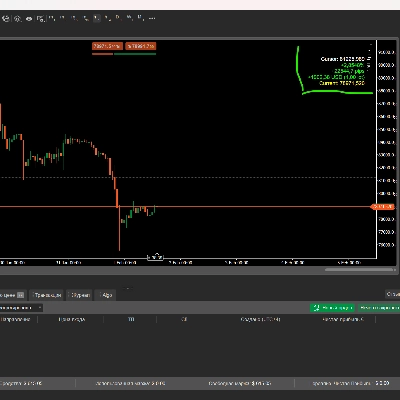
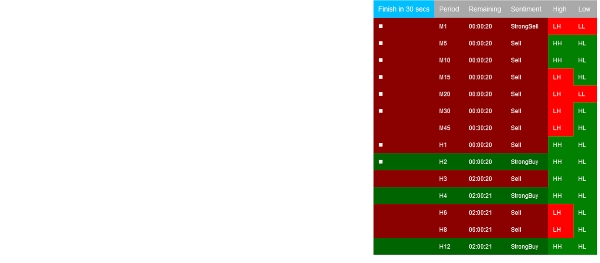
Thông thường, tâm lý tăng giá được xác định khi giá đóng cửa kết thúc cao hơn đáng kể so với giá mở cửa, cho thấy áp lực mua mạnh. Tâm lý giảm giá được phát hiện khi giá đóng cửa thấp hơn đáng kể so với giá mở cửa, báo hiệu áp lực bán mạnh. Các thanh trung lập, thường gọi là "doji," phản ánh sự do dự hoặc cân bằng giữa người mua và người bán.
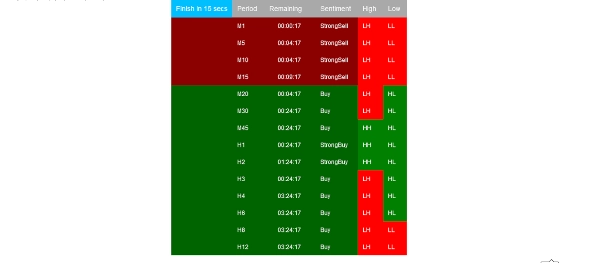
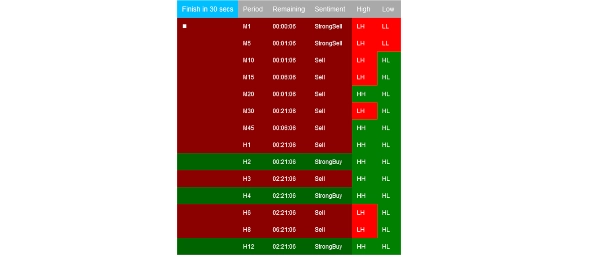
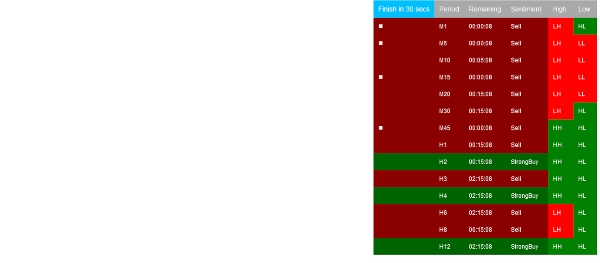
Các phiên bản nâng cao của Chỉ báo Cảm xúc Thanh có thể kết hợp các yếu tố bổ sung như khối lượng, kích thước thân tương đối hoặc động lượng để tinh chỉnh phân loại tâm lý. Tâm lý thường được trực quan hóa thông qua mã màu—xanh lá cho tăng giá, đỏ cho giảm giá, và xám hoặc xanh dương cho trung lập—giúp dễ dàng đánh giá nhanh tông màu thị trường hiện tại.
Nếu 1 và 0 là những khối xây dựng của kỹ thuật phần mềm, thì đầu ra của Chỉ báo Biểu đồ Cảm xúc Thanh đại diện cho những khối xây dựng cơ bản của các hệ thống giao dịch học máy tiên tiến. Bằng cách định lượng tâm lý thị trường thô, nó cung cấp các đầu vào thiết yếu cho các thuật toán nhằm học hỏi và dự đoán các chuyển động giá trong tương lai dựa trên hành vi lịch sử.
Sử dụng Chỉ báo Biểu đồ Cảm xúc Thanh, các nhà giao dịch có được hiểu biết sâu sắc hơn về động lực vi mô của thị trường, giúp họ xác định sức mạnh xu hướng, khả năng đảo chiều và các giai đoạn tích lũy—đặc biệt khi kết hợp với phân tích đa khung thời gian và các công cụ kỹ thuật khác.
Tóm tắt
Advanced versions may integrate factors like volume, relative body size, or momentum to enhance sentiment accuracy. The indicator typically uses color-coding—green for bullish, red for bearish, and gray or blue for neutral—to visually represent market tone. By quantifying raw market sentiment, it provides foundational data useful for machine learning trading systems aiming to predict future price movements.
Traders can use this indicator to gain insight into micro market dynamics, helping to identify trend strength, potential reversals, and consolidation phases. It is particularly effective when combined with multi-timeframe analysis and other technical tools.
Đánh giá của khách hàng
5 | 100 % | |
4 | 0 % | |
3 | 0 % | |
2 | 0 % | |
1 | 0 % |