
Beschreibung
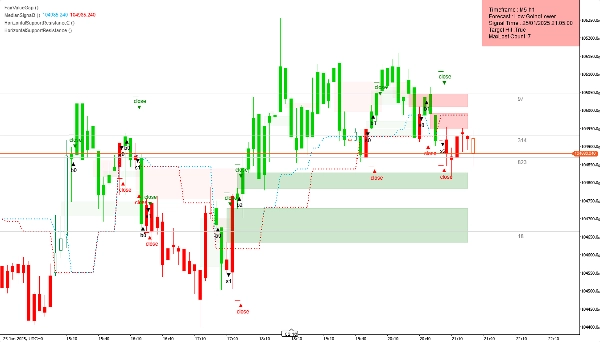
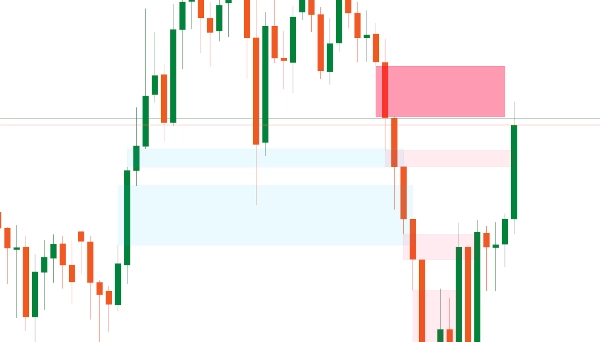
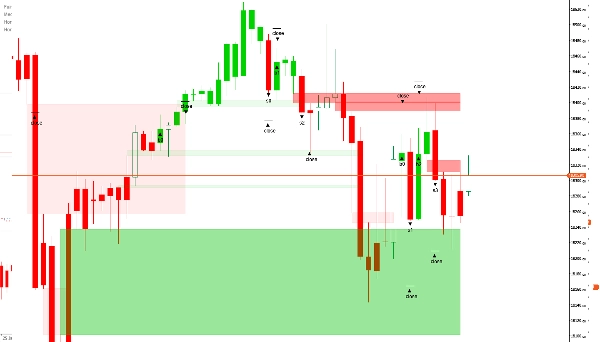
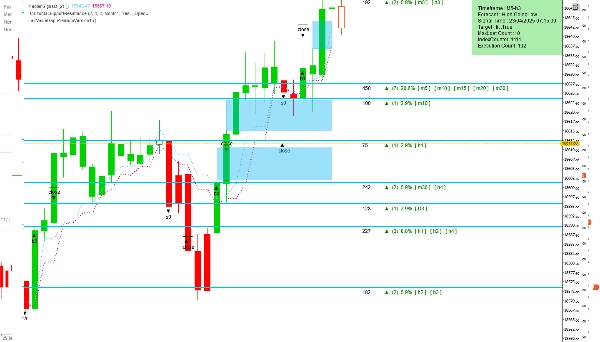
Der Fair Value Gap (FVG) Indikator ist ein Werkzeug der technischen Analyse, das entwickelt wurde, um potenzielle Preisungleichgewichte im Markt zu identifizieren. Diese Lücken entstehen, wenn sich der Preis schnell bewegt und eine Zone mit minimaler Handelsaktivität schafft – oft als „Leere“ bezeichnet. Solche Ungleichgewichte können auf eine Wahrscheinlichkeit einer Preisrückkehr hinweisen, da der Markt dazu neigt, durch das erneute Aufsuchen dieser Bereiche ein Gleichgewicht herzustellen.
Einstellungen Übersicht
- Zu ladende Balken: Gibt die Anzahl der historischen Balken an, die analysiert werden sollen, beginnend mit dem zuletzt abgeschlossenen und rückwärts gehend.
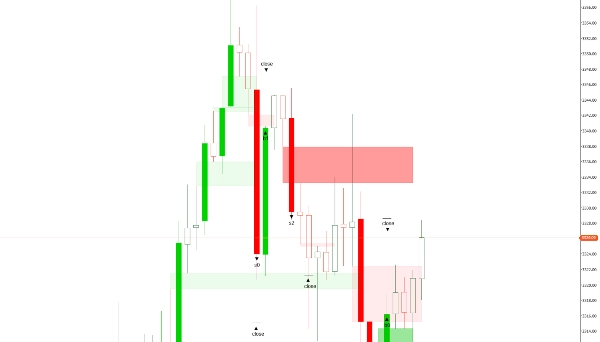
- Farbe des bullischen FVG: Legt die Farbe für FVGs fest, die in einem Aufwärtstrend erscheinen. Es wird eine Transparenz von 30 % angewendet, damit Elemente hinter der Lücke sichtbar bleiben.
- Farbe des bärischen FVG: Legt die Farbe für FVGs fest, die in einem Abwärtstrend erscheinen, ebenfalls mit 30 % Transparenz für bessere Sichtbarkeit im Chart.
Premium-Funktionen (Verfügbar in der kostenpflichtigen Version)
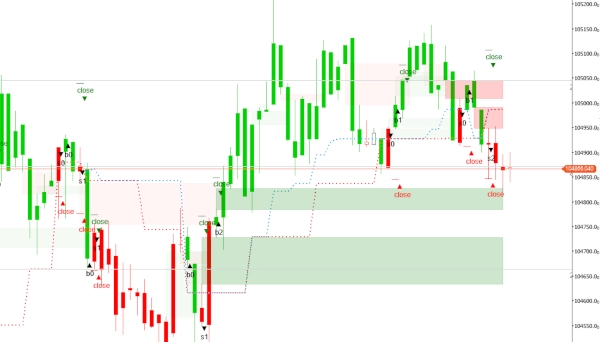
- Geschlossene Lücken löschen: Eine boolesche Einstellung – wenn aktiviert („ja“), werden automatisch alle geschlossenen Lücken entfernt; wenn deaktiviert („nein“), bleiben die Lücken sichtbar. Dies ist besonders nützlich bei niedrigeren Zeitrahmen (unter 20 Minuten).
- Lücken bearbeiten/entfernen: Ermöglicht es Tradern, Lücken manuell anzupassen oder zu löschen. Dies gibt erfahrenen Tradern mehr Kontrolle, insbesondere da sehr kleine Lücken typischerweise wenig Einfluss auf die Preisbewegung haben.
- Zeitrahmen einstellen: Bietet zwei Optionen – den aktuellen Chart-Zeitrahmen verwenden oder einen anderen für die Analyse auswählen, während die Ergebnisse weiterhin im Hauptchart angezeigt werden. Diese Funktion hilft Tradern, schneller Einblicke in wahrscheinliche Marktbewegungen zu gewinnen.
- Ausgewählter Zeitrahmen: Gibt den gewünschten Analysezeitraum an, falls oben „Ausgewählter Zeitrahmen“ gewählt wurde.
- Genauigkeit kleiner Lücken: Ermöglicht Tradern, eine bevorzugte Lückengröße als Ganzzahl einzugeben, um Lücken zu identifizieren, die historisch zu günstigen Ergebnissen führen. Der Wert basiert auf dem gesamten Datensatz und den beobachteten Lückengrößen für das Asset.
Standardmäßig scannt der Indikator alle Ungleichgewichte innerhalb eines einzelnen Zeitrahmens. Der Zugang zu Premium-Funktionen über die FairValueGapPremium Version kann die Analysefähigkeiten jedoch erheblich verbessern.
Zusammenfassung
Key settings include:
- Bars To Load: number of historical bars analyzed from the most recent backward.
- Bullish FVG Color: customizable color for gaps in uptrends with 30% transparency.
- Bearish FVG Color: customizable color for gaps in downtrends with 30% transparency.
Premium features (available in the paid version) enhance functionality by allowing:
- Automatic deletion of closed gaps, useful for lower timeframes.
- Manual editing or removal of gaps for finer control.
- Selection of analysis timeframe independent of the chart’s timeframe.
- Input of preferred gap size to improve identification accuracy based on historical data.
By default, the indicator scans imbalances within a single timeframe, with premium options providing expanded analytical capabilities.
Kundenbewertungen
5 | 50 % | |
4 | 50 % | |
3 | 0 % | |
2 | 0 % | |
1 | 0 % |


