
Beschreibung
Hauptmerkmale
- ATR-basierter dynamischer Stopp: Passt den Trailing-Stop-Abstand automatisch an die aktuelle Marktvolatilität an – weiter bei volatilen Bedingungen, enger bei ruhigen Märkten
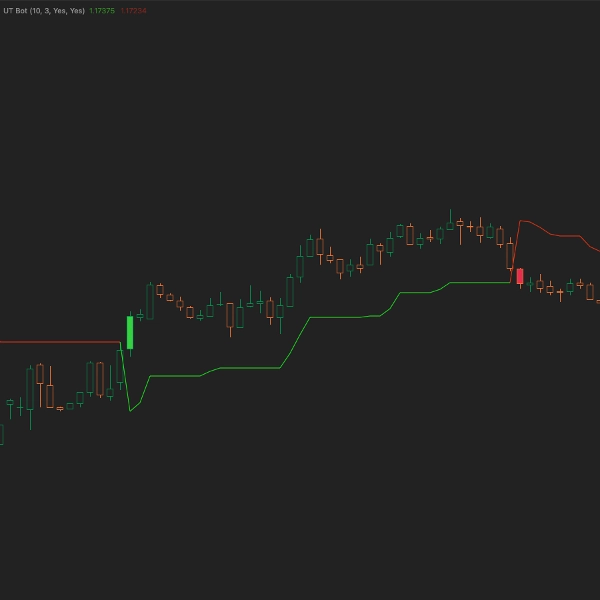
- Klare visuelle Signale: Limettenfarbener Balken für Aufwärtstrend, karminroter Balken für Abwärtstrend – erkennen Sie die Trendrichtung auf einen Blick, ohne Ihr Chart zu überladen
- Optionale Benachrichtigungen: Aktivieren Sie Popup-Benachrichtigungen und Soundalarme, um auch bei Abwesenheit vom Bildschirm über Trendänderungen informiert zu bleiben
- Balkenfärbung bei Signalen: Balken färben sich sofort bei Trendwechsel, was Ihnen eine visuelle Bestätigung gibt, wenn der Preis das Trailing-Stop-Niveau überschreitet
Funktionsweise
Der UT Bot berechnet einen Trailing-Stop basierend auf der ATR-Periode multipliziert mit Ihrer Sensitivitätseinstellung. Wenn der Preis über dem Stopp liegt, ist der Trend bullisch. Wenn der Preis darunter fällt, kehrt sich der Trend zu bärisch um. Der Indikator verfolgt diese Übergänge und färbt die Balken, um potenzielle Ein- oder Ausstiege zu signalisieren.
Der Trailing-Stop bewegt sich nur in Trendrichtung – er steigt während Aufwärtstrends und fällt während Abwärtstrends, sichert Gewinne ab und gibt Trades gleichzeitig Spielraum.
Parameter
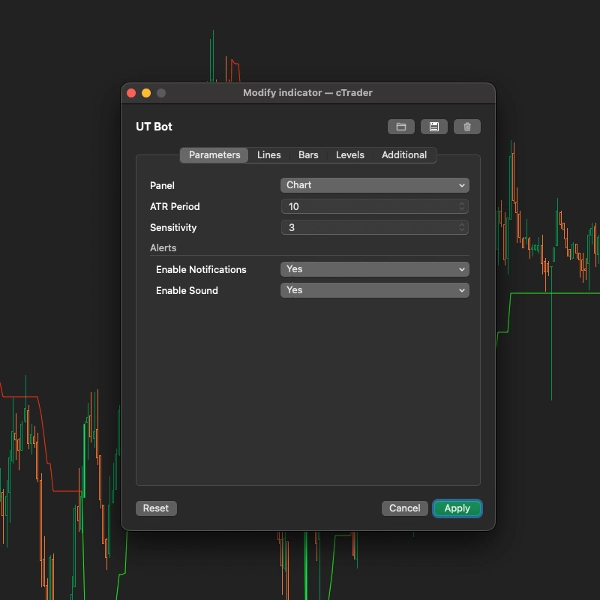
Kerneinstellungen
- ATR-Periode (Standard: 10): Anzahl der Balken, die zur Berechnung der Average True Range verwendet werden. Höhere Werte = glattere, aber langsamere Signale
- Sensitivität (Standard: 3.0): Multiplikator für ATR-Abstand. Höhere Werte erzeugen einen weiteren Trailing-Stop (weniger Fehlsignale, spätere Einstiege). Niedrigere Werte erzeugen engere Stops (mehr Signale, mehr falsche Umkehrungen)
Benachrichtigungseinstellungen
- Benachrichtigungen aktivieren (Standard: Aus): Popup-Benachrichtigungen bei Trendwechsel anzeigen
- Sound aktivieren (Standard: Aus): Ton abspielen bei Trendwechsel (positiver Ton für bullisch, negativer für bärisch)
Ideal für
- Trendtrader, die eine dynamische Stop-Loss-Platzierung benötigen
- Trader, die eine klare visuelle Trendrichtung wünschen
- Alle, die ein mechanisches Trendfolgesystem suchen
- Scalper bis Swing-Trader (Sensitivität entsprechend anpassen)
Tipps
- Scalping: Verwenden Sie ATR-Periode 5-7, Sensitivität 1,5-2,0 für schnellere Signale
- Swing Trading: Verwenden Sie ATR-Periode 10-14, Sensitivität 3,0-4,0 für weniger Fehlsignale
- Bestätigung: Kombinieren Sie mit Volumen oder anderen Indikatoren für Eintritte mit höherer Wahrscheinlichkeit
Zusammenfassung
Key functionalities include detecting bullish and bearish momentum shifts when price crosses the trailing stop, visually signaling these reversals by coloring bars green for bullish flips and red for bearish flips, and drawing adaptive trailing stop bands above or below price. The indicator is non-repainting and overlays directly on the chart for immediate insight.
Users can customize core parameters such as ATR period (default 10) and sensitivity (default 3), and enable optional popup and sound alerts for trend changes. UT Bot is suitable for various markets including Forex, indices, and cryptocurrencies like BTCUSD and XAUUSD. It is recommended to use UT Bot alongside trend filters or volume indicators to enhance confirmation in trending or breakout environments.
Kundenbewertungen
5 | 67 % | |
4 | 33 % | |
3 | 0 % | |
2 | 0 % | |
1 | 0 % |


![„[Hamster-Coder] Pivot Points MTF“-Logo](https://cdn.ctrader.com/image/webp/4c143e5a-309c-40e3-a578-f04d1e133ffa_31159)


![„[Stellar Strategies] MARSI Signal Plotter“-Logo](https://cdn.ctrader.com/image/webp/7b2b8da6-8f8e-4646-8d4a-4710c516c01e_25567)