
Beschreibung
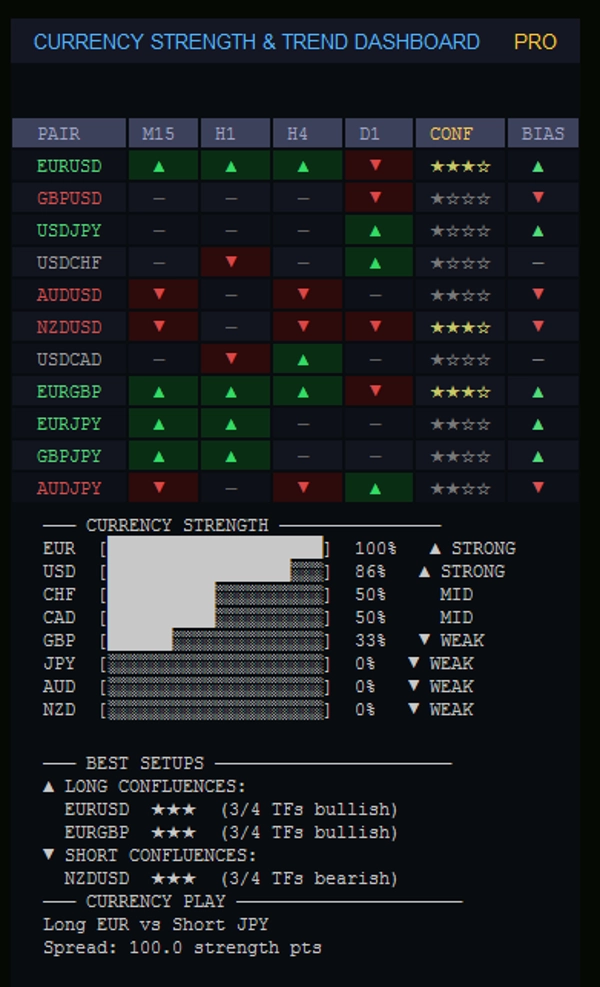
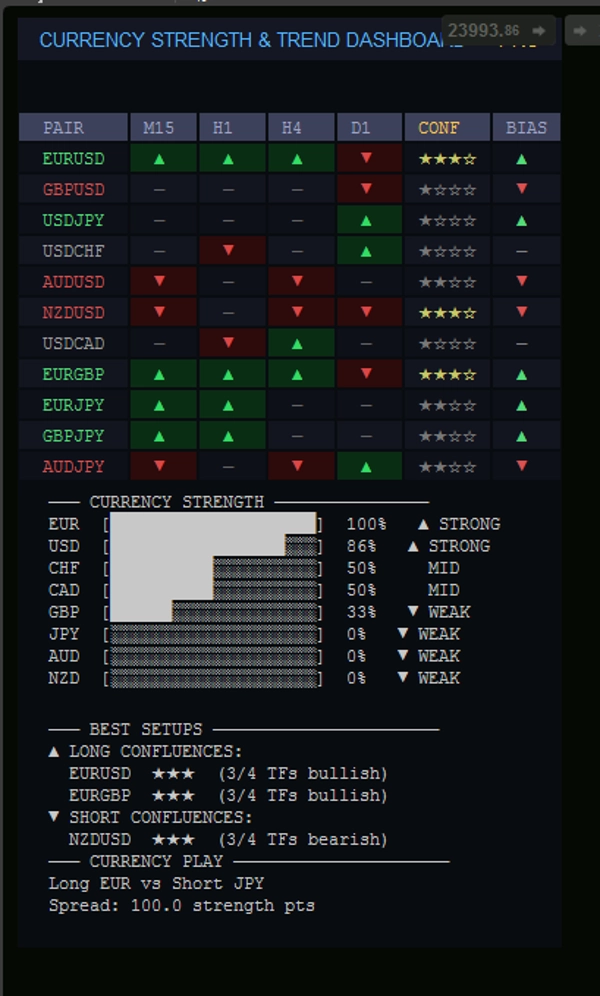
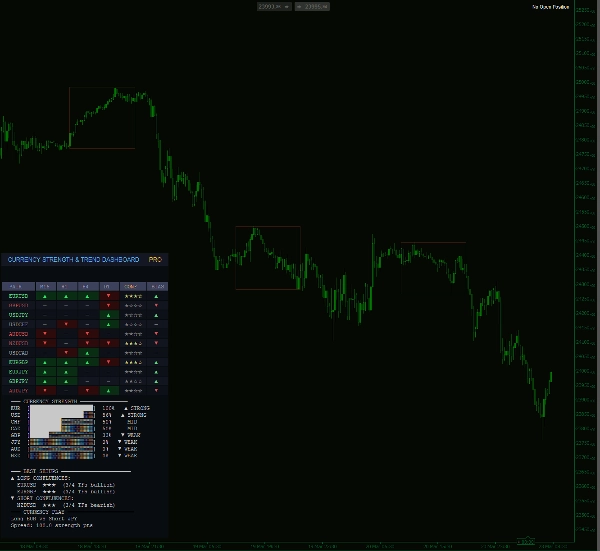
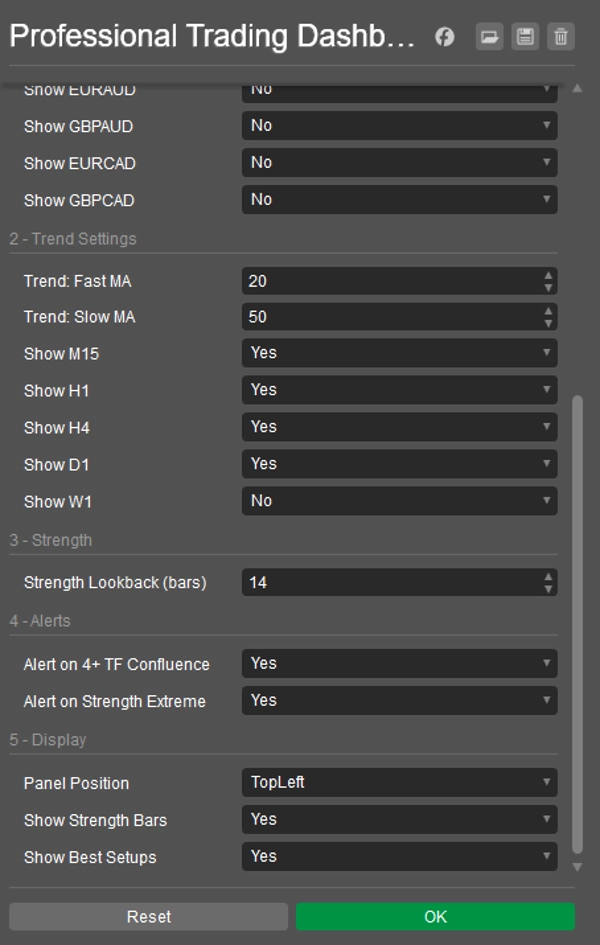
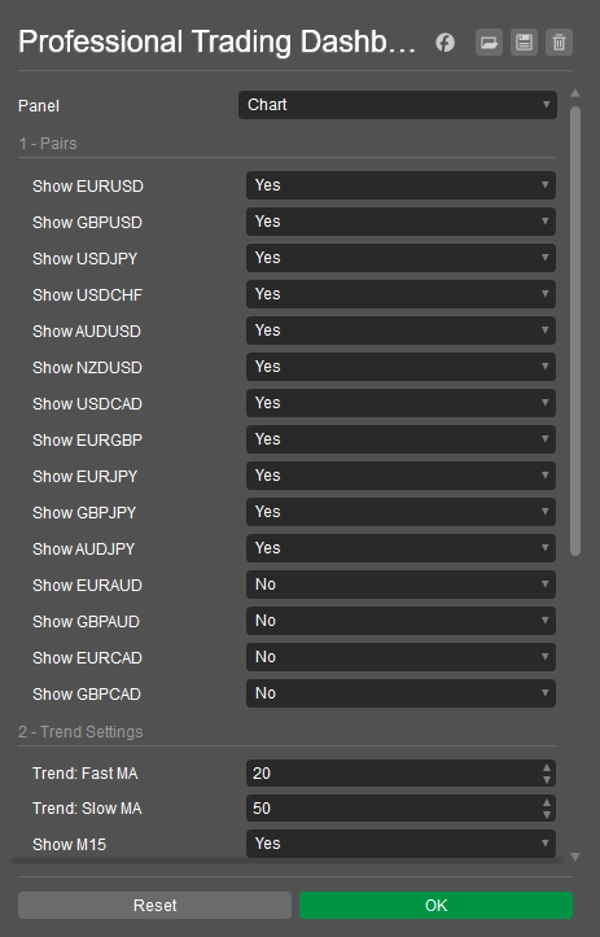
Das Currency Strength & Trend Dashboard bringt das eine Tool, auf das ernsthafte Forex-Trader vertrauen — und das cTrader bisher nie hatte — direkt in Ihre Charts. Laden Sie es in jeden Chart und es scannt sofort bis zu 15 Währungspaare über fünf Zeitrahmen gleichzeitig, sodass Sie ein vollständiges Bild der Marktstruktur erhalten, ohne ein einziges zusätzliches Fenster öffnen zu müssen.
Das Heatmap-Raster kodiert jedes Paar und jeden Zeitrahmen auf einen Blick farblich. Grün bedeutet Aufwärtstrend, Rot bedeutet Abwärtstrend, Grau bedeutet keine klare Tendenz. Eine Konfluenz-Sternbewertung zeigt, wie viele Zeitrahmen sich auf eine Richtung einigen — fünf Sterne bedeuten, dass alle Zeitrahmen übereinstimmen. Der Gesamtbias-Pfeil gibt Ihnen die sofortige Einschätzung: Long, Short oder Warten.
Ein Live-Bereich zur Währungsstärke ordnet alle acht Hauptwährungen vom stärksten bis zum schwächsten mit einem Prozentwert und einer visuellen Leiste ein. Das stärkste gegen das schwächste Paar wird automatisch als logischer Trade der Sitzung identifiziert. Ein Panel mit den besten Setups zeigt die Paare mit der höchsten Konfluenz, sodass Sie nie manuell scannen müssen.
Alarme werden ausgelöst, wenn vier oder mehr Zeitrahmen bei einem einzelnen Paar übereinstimmen und wenn eine Währung einen extremen Stärke-Wert erreicht. Alles aktualisiert sich Balken für Balken automatisch in jedem Chart, an das Sie es anhängen.
Zusammenfassung
Additionally, the dashboard ranks the eight major currencies by strength with percentage scores and visual bars. It automatically identifies the strongest versus weakest currency pairs as logical trade opportunities. A best setups panel highlights pairs with the highest confluence to streamline decision-making. Alerts notify users when four or more timeframes align on a pair or when any currency reaches an extreme strength level. The dashboard updates automatically on each new bar and can be loaded on any chart within cTrader, consolidating multiple analytical tools into one interface for efficient forex trading analysis.
Kundenbewertungen
5 | 100 % | |
4 | 0 % | |
3 | 0 % | |
2 | 0 % | |
1 | 0 % |


