
Description
Zones de liquidité Heatmap
Visualisez le volume-au-prix, découvrez les supports/résistances cachés et suivez la liquidité du marché en temps réel.
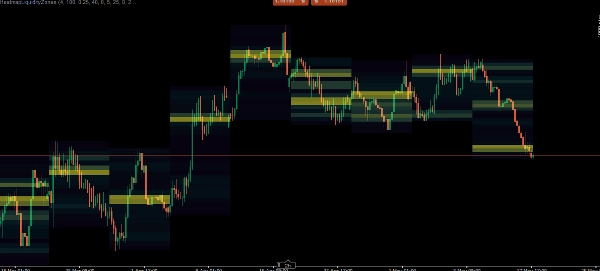
L'indicateur Zones de liquidité Heatmap est un puissant outil de profilage de volume qui traduit les données brutes du marché en une heatmap visuelle intuitive. En analysant le volume des ticks sur des périodes plus longues spécifiques (HTF), il identifie exactement où la pression d'achat et de vente la plus significative est concentrée.
Au lieu de deviner où le marché pourrait inverser, cet indicateur trace des niveaux de liquidité précis, basés sur le volume. Ces niveaux s'étendent dynamiquement vers l'avant et disparaissent automatiquement une fois que le prix les franchit et les invalide, gardant votre graphique propre et strictement pertinent par rapport à l'action actuelle du prix.
Caractéristiques principales
Heatmap multi-périodes : Sélectionnez votre période macro préférée (1H, 4H, Quotidien, Hebdomadaire ou Mensuel). L'indicateur cartographiera la distribution du volume pour cette période spécifique directement sur vos graphiques de périodes inférieures.
Binning ATR dynamique : L'échelle des prix est découpée en "bins" (zones) dynamiques calculés à l'aide de la plage vraie moyenne (ATR). Cela garantit que la heatmap s'adapte intelligemment aux marchés très volatils comme aux marchés en consolidation serrée.
Niveaux de liquidité auto-invalideurs : Lorsqu'un bin de prix spécifique accumule un volume massif, il devient un "Niveau de liquidité". L'indicateur trace une ligne solide s'étendant dans le futur. Si le prix franchit avec succès ce niveau, la ligne est automatiquement supprimée (invalidée).
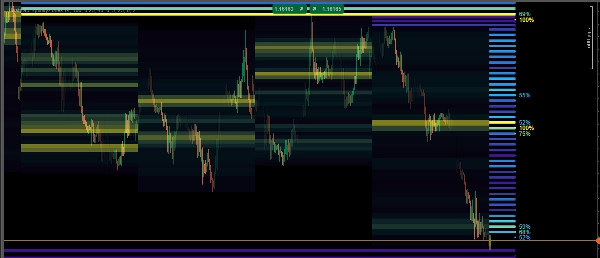
Coloration en dégradé de densité : Distinguez visuellement les nœuds de volume Faible, Moyen et Élevé. La heatmap utilise un dégradé de couleurs pour vous montrer exactement où le volume le plus important est piégé.
Suivi en pourcentage : Les niveaux de liquidité à haute densité affichent une étiquette en pourcentage (par exemple, 85 %), montrant exactement la force de ce nœud par rapport au reste du volume de la période HTF.
Résumé
The indicator segments the price scale into dynamic zones based on the Average True Range (ATR), adapting to market volatility. It highlights significant volume clusters as liquidity levels with solid lines extending forward. These lines automatically disappear if the price breaks through the level, ensuring the chart remains focused on relevant, current price action.
A color gradient visually distinguishes low, medium, and high volume nodes, while percentage labels indicate the relative strength of high-density liquidity levels within the chosen timeframe. This tool supports traders in tracking market liquidity in real-time and making volume-backed decisions regarding support and resistance areas.
Avis clients
5 | 100 % | |
4 | 0 % | |
3 | 0 % | |
2 | 0 % | |
1 | 0 % |


